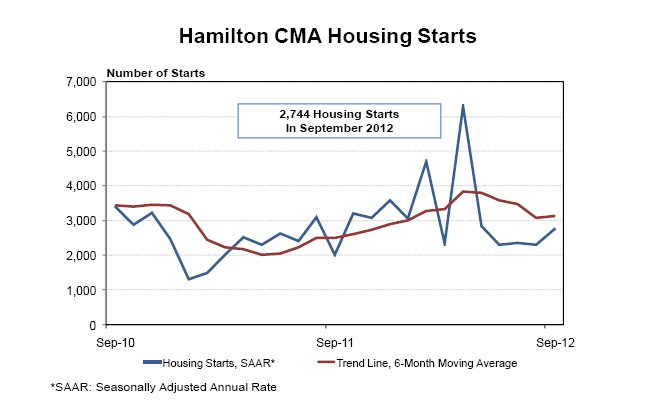
TORONTO, ONTARIO--(Marketwire - Oct. 9, 2012) - Housing starts in Hamilton, Census Metropolitan Area (CMA) were trending at 3,136 units in September, according to Canada Mortgage and Housing Corporation (CMHC). The trend is a six month moving average of the monthly seasonally adjusted annual rates (SAAR)1 of housing starts. The standalone monthly SAAR was 2,744 units in September, up from 2,298 units in August.
"After nine months, both singles and multiple starts have risen from the previous year. Low mortgage rates, positive migration flows and fewer listings on the existing home market have supported residential construction activity in 2012," said Abdul Kargbo, CMHC's Senior Market Analyst for Hamilton and Brantford CMAs.
CMHC uses the trend measure as a complement to the monthly SAAR of housing starts to account for considerable swings in monthly estimates and obtain a more complete picture of the state of the housing market. In some situations, analysing only SAAR data can be misleading in some markets, as they are largely driven by the multiples segment of the markets which can be quite variable from one month to the next. The multiples segment includes apartments, rows and semi-detached homes.
Single-detached starts moderated in September 2012. However, multiple starts totalled 159 actual units in September, three times the number of units reported in September of last year. Year-to-date, total housing starts have reached 2,422 actual units with activity almost evenly split between both singles and multiple starts. On a sub-market basis, between January and September 2012, total starts in Burlington and the City of Hamilton were higher than they were during the first nine months of 2011. Meanwhile, residential construction activity in Grimsby remained below last year's level.
Preliminary Housing Starts data is also available in English and French at the following link: http://www.cmhc.gc.ca/en/hoficlincl/homain/stda/index.cfm
As Canada's national housing agency, CMHC draws on more than 65 years of experience to help Canadians access a variety of quality, environmentally sustainable and affordable housing solutions. CMHC also provides reliable, impartial and up-to-date housing market reports, analysis and knowledge to support and assist consumers and the housing industry in making informed decisions.
1 All starts figures in this release, other than actual starts and the trend estimate, are seasonally adjusted annual rates (SAAR) - that is, monthly figures adjusted to remove normal seasonal variation and multiplied by 12 to reflect annual levels. By removing seasonal ups and downs, seasonal adjustment allows for a comparison from one season to the next and from one month to the next. Reporting monthly figures at annual rates indicates the annual level of starts that would be obtained if the monthly pace was maintained for 12 months. This facilitates comparison of the current pace of activity to annual forecasts as well as to historical annual levels.
Additional data is available upon request.
(Ce document existe également en français)
To view the accompanying graph, visit the following link: http://media3.marketwire.com/docs/Hamilton_CMASept.jpg
| Preliminary Housing Start Data | |||
| September / 2011-2012 | |||
| Hamilton, CMA1 | September 2011 | September 2012 | |
| Actual | |||
| September - Single-Detached | 136 | 82 | |
| September - Multiples | 52 | 159 | |
| September - Total | 188 | 241 | |
| January to September - Single-Detached | 1,033 | 1,073 | |
| January to September - Multiples | 628 | 1,349 | |
| January to September - Total | 1,661 | 2,422 | |
| August 2012 | September 2012 | ||
| SAAR2 | |||
| Total | 2,298 | 2,744 | |
| Source: CMHC | |||
| 1 Census Metropolitan Area | |||
| 2 Seasonally Adjusted at Annual Rates | |||
| Detailed data available upon request. | |||
| Hamilton Preliminary Actual Housing Start Data by Type | |||||||||||
| September / 2011-2012 | |||||||||||
| Hamilton, CMA1 | Single | Semi | Row | Apt | Total |
||||||
| 2011 | 2012 | 2011 | 2012 | 2011 | 2012 | 2011 | 2012 | 2011 | 2012 | ||
| Sub-markets within the CMA | |||||||||||
| Burlington | 25 | 2 | 0 | 0 | 0 | 0 | 0 | 0 | 25 | 2 | |
| City of Hamilton | 106 | 73 | 0 | 20 | 8 | 100 | 0 | 39 | 114 | 232 | |
| Grimsby | 5 | 7 | 0 | 0 | 44 | 0 | 0 | 0 | 49 | 7 | |
| Sub-markets outside the CMA | |||||||||||
| Halton Hills | 8 | 70 | 0 | 0 | 0 | 0 | 0 | 0 | 8 | 70 | |
| Milton | 35 | 113 | 18 | 20 | 0 | 227 | 0 | 75 | 53 | 435 | |
| Oakville | 14 | 7 | 0 | 8 | 0 | 119 | 0 | 0 | 14 | 134 | |
| Total Hamilton CMA Starts | 136 | 82 | 0 | 20 | 52 | 100 | 0 | 39 | 188 | 241 | |
| Hamilton Preliminary Actual Housing Start Data by Type | |||||||||||
| January to September / 2011-2012 | |||||||||||
| Hamilton, CMA1 | Single | Semi | Row | Apt | Total |
||||||
| 2011 | 2012 | 2011 | 2012 | 2011 | 2012 | 2011 | 2012 | 2011 | 2012 | ||
| Sub-markets within the CMA | |||||||||||
| Burlington | 265 | 75 | 4 | 0 | 31 | 90 | 75 | 338 | 375 | 503 | |
| City of Hamilton | 691 | 967 | 2 | 88 | 326 | 655 | 95 | 108 | 1114 | 1818 | |
| Grimsby | 77 | 31 | 0 | 0 | 95 | 70 | 0 | 0 | 172 | 101 | |
| Sub-markets outside the CMA | |||||||||||
| Halton Hills | 66 | 126 | 2 | 0 | 9 | 25 | 0 | 0 | 77 | 151 | |
| Milton | 619 | 515 | 34 | 116 | 251 | 839 | 216 | 152 | 1120 | 1622 | |
| Oakville | 399 | 175 | 32 | 8 | 272 | 346 | 0 | 268 | 703 | 797 | |
| Total Hamilton CMA Starts | 1033 | 1073 | 6 | 88 | 452 | 815 | 170 | 446 | 1661 | 2422 | |
| 1 Census Metropolitan Area |
Contact Information:
Abdul Kargbo
416-250-3294
akargbo@cmhc.ca
Media Contact:
Beth Bailey
416-218-3355
bbailey@cmhc.ca