NORFOLK, NE--(Marketwire - Aug 10, 2012) - Supertel Hospitality, Inc. (
Second Quarter 2012 Highlights
- Increased revenues from continuing operations 5.5 percent to $21.6 million.
- Advanced RevPAR 3.9 percent to $35.69 for the 74 same store hotels in continuing operations.
- Reduced loss from continuing operations to $2.7 million, an improvement of 36.6 percent over the same year-ago period.
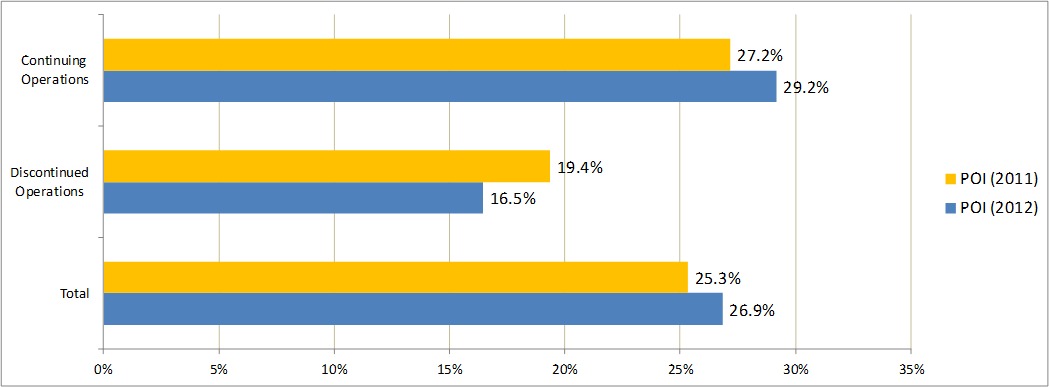
- Improved continuing operations Property Operating Income (POI) $0.7 million, or 13.3 percent.
- Improved net income attributable to common shareholders to $1.6 million, primarily on gains from the sale of four non-strategic hotels.
- Improved Adjusted EBITDA by $0.4 million, or 6.5% percent, over the same year-ago period.
- Sold four economy hotels generating gross proceeds of $9.6 million.
- Moved into the upscale segment with the purchase of a 100-room Hilton Garden Inn on Solomons Island in Maryland.
Second Quarter Operating and Financial Results
Revenues from continuing operations for the 2012 second quarter rose $1.1 million, or 5.5 percent, to $21.6 million, compared to the same year-ago period. The improved performance primarily was due to the increased average daily rate (ADR) of the same store portfolio, in addition to the acquisition of the Hilton Garden Inn.
The company reported net income attributable to common shareholders of $1.6 million, or $0.07 per diluted share for the 2012 second quarter, compared to a net loss of $(4.5) million or $(0.20) per diluted share for the same 2011 period. The second quarter increase of $6.1 million is primarily attributable to a $4.4 million increase in gains related to dispositions of hotels, a $0.9 million unrealized gain from the reduction in fair market value of the derivative liabilities, and a $0.7 million decrease in total non cash impairment losses; the total non cash impairment losses for the three months ended June 30, 2012 were $4.1 million versus $4.8 million for the like prior period.
Funds from operations (FFO) in the 2012 second quarter was $3.1 million, compared to $2.6 million in the same 2011 period. Adjusted funds from operations (AFFO), which is FFO adjusted to include gain or exclude losses on derivatives and exclude acquisition expense, in the 2012 second quarter was $2.4 million, compared to $2.6 million in the same 2011 period.
Earnings before interest, taxes, depreciation and amortization, (EBITDA) increased to $6.7 million, compared to $1.0 million for the second quarter of 2011. Adjusted EBITDA, which is EBITDA before non-controlling interest, net gain on disposition of assets, impairment, preferred stock dividends, unrealized gain/loss on derivatives and acquisition expense, increased to $6.2 million, or 6.5 percent compared to $5.8 million for the second quarter of 2011.
In the 2012 second quarter, the 74-hotel same store portfolio reported an increase in revenue per available room (RevPAR) of 3.9 percent led by a 3.1 percent improvement in ADR and a 0.7 percent increase in occupancy, compared to the 2011 second quarter.
"The significantly improved results in the 2012 second quarter reflect the full ramp-up of our management companies, the continued improvement in our portfolio make-up and the benefits of the infusion of $30 million in new equity in the 2012 first quarter," said Kelly A. Walters, Supertel president and CEO.
| Second Quarter 2012 vs Second Quarter 2011 | ||||||||||||||||||
| Occ % | ADR ($) | RevPAR ($) | ||||||||||||||||
| 2012 | 2011 | Variance | 2012 | 2011 | Variance | 2012 | 2011 | Variance | ||||||||||
| Industry - Total US Market | 65.1% | 63.2% | 3.1% | 106.41 | 101.63 | 4.7% | 69.32 | 64.22 | 7.9% | |||||||||
| Supertel - Same Store Operations (74 hotels) | 67.9% | 67.4% | 0.7% | 52.54 | 50.98 | 3.1% | 35.69 | 34.34 | 3.9% | |||||||||
| Chain Scale | ||||||||||||||||||
| Industry - Upper Midscale | 67.7% | 65.4% | 3.4% | 98.29 | 94.38 | 4.2% | 66.50 | 61.73 | 7.7% | |||||||||
| Supertel - Upper Midscale (21) | 71.2% | 69.5% | 2.4% | 72.99 | 71.23 | 2.5% | 51.95 | 49.51 | 4.9% | |||||||||
| Industry - Midscale | 58.9% | 56.6% | 4.0% | 74.96 | 72.53 | 3.4% | 44.17 | 41.08 | 7.5% | |||||||||
| Supertel - Midscale (6) | 56.6% | 47.6% | 18.9% | 64.83 | 63.53 | 2.0% | 36.68 | 30.24 | 21.3% | |||||||||
| Industry - Economy | 57.6% | 56.3% | 2.2% | 52.76 | 50.47 | 4.5% | 30.36 | 28.42 | 6.8% | |||||||||
| Supertel - Economy (40) | 66.5% | 66.9% | -0.6% | 50.47 | 49.46 | 2.0% | 33.54 | 33.07 | 1.4% | |||||||||
| Industry - Extended Stay | n/a | n/a | n/a | n/a | n/a | n/a | n/a | n/a | n/a | |||||||||
| Supertel - Extended Stay (7) | 71.7% | 73.1% | -1.9% | 24.71 | 23.75 | 4.0% | 17.72 | 17.37 | 2.0% | |||||||||
| Industry Source: STR Monthly Review | ||||||||||||||||||
Upscale Hotels
The operating results for the Hilton Garden Inn, which was purchased on May 25, 2012, are not reflected in the 74 same store hotel operating results. The hotel generated RevPAR of $93.04, driven by $126.05 ADR and 73.8 percent occupancy during the period of May 25, 2012, through June 30, 2012.
Upper Midscale Hotels
Second quarter RevPAR for the company's 21 continuing operations, upper midscale hotels rose 4.9 percent to $51.95, led by a 2.5 percent improvement in ADR to $72.99 and a 2.4 percent increase in occupancy. Upper midscale hotel brands currently in the company's portfolio include Comfort Inns, Comfort Suites, Hampton Inn and Holiday Inn Express.
Midscale Hotels
RevPAR for the company's six continuing operations midscale hotels rose sharply, 21.3 percent, to $36.68. Occupancy increased 18.9 percent with an ADR increase of 2.0 percent to $64.83. Supertel's midscale brands include Quality Inn, Sleep Inn, Baymont Inn and Ramada Limited.
Economy Hotels
The company's 40 continuing operations economy hotels reported a 1.4 percent increase in RevPAR to $33.54 in the 2012 second quarter as a result of a 2.0 percent rise in ADR to $50.47, partially offset by a 0.6 percent decrease in occupancy. Supertel's branded properties in this segment include Days Inn, Super 8, Key West Inns and Guesthouse Inn.
Extended Stay Hotels
The company's seven continuing operations, extended-stay hotels reported a 2.0 percent increase in RevPAR to $17.72, led by a 4.0 percent increase in ADR to $24.71, partially offset by a 1.9 percent decline in occupancy. Hotels in this segment include the Savannah Suites brand.
"While we are not yet satisfied with our performance in the midscale segment, overall, our hotels continue to achieve above average occupancy compared to the industry, which provides opportunities to increase ADR," Walters noted. "We have instructed our operators to evaluate raising room rates as aggressively as possible, while carefully monitoring market conditions and adjusting accordingly. We believe there is still room for ADR improvement, without materially impacting occupancy."
"Our operators have done a noteworthy job in controlling costs, which is reflected in our 4.6 percent increase for the quarter in property operating income of the total portfolio," he added. "Year-to-date through the second quarter, revenues rose at twice the rate of incremental labor costs; and management fees remained essentially flat on higher revenues when compared with last year. We attribute the bulk of these improvements to our 2011 decision to move to regional operators from one centralized management company.
"What makes these results all the more gratifying is that many of our markets are in smaller population centers," he noted. "While they did not suffer as much in the downturn, many of these markets continue to lag behind in the rebound. Although our results were not as strong as the industry as a whole in the 2012 second quarter, we believe they showed good growth given the local economies in which they operate."
Interest expense from continuing operations decreased slightly to $2.1 million for the quarter. In addition, the company temporarily paid its credit line down to zero by applying the unused portion of its recent equity infusion. A portion of the credit line is expected to be invested in hotel acquisitions by year end. Depreciation and amortization expense from continuing operations declined $0.1 million from the 2011 second quarter to $2.2 million.
Property operating income (POI) from continuing operations for the 2012 second quarter rose $0.7 million, or 13.3 percent, compared to the same period a year earlier. The increase was led by higher same store room revenue, and improved expense management by our new operators, and $0.1 million of POI from the new Hilton Garden Inn in Solomons, Maryland. POI is calculated as revenue from room rentals and other hotel services less hotel and property operations expenses. See attached chart (Property Operating Income Percent Second Quarter 2012 versus Second Quarter 2011).
Year-to-Date Operating and Financial Results
Revenues from continuing operations for the six months ended June 30, 2012 rose $1.5 million or 4.2 percent, to $38.2 million, compared to $36.7 million for the same year-ago period.
Net loss attributable to common shareholders was $(3.0) million, or $(0.13) per diluted share for the six months ended June 30, 2012, compared to a net loss of $(8.5) million, or $(0.37) per diluted share for the same 2011 period.
RevPAR for the 74 same store hotels was $31.82, a 2.9 percent increase compared to the same period in 2011.
FFO for the six months ended June 30, 2012 was $1.6 million, compared to $1.6 million for the same 2011 period. The company's Adjusted FFO for six months ended June 30, 2012 was $2.1 million, which is an increase of $0.5 million over the $1.6 million reported at June 30, 2011.
Earnings before interest, taxes, depreciation and amortization, impairment, non controlling interest, net gain on disposition of assets, preferred stock dividends, unrealized gain/loss on derivatives and acquisition expense (Adjusted EBITDA) increased to $8.5 million, compared to $7.2 million for the prior year.
Acquisition Activity
On May 25, the company purchased, in an all cash transaction, the 100-room Hilton Garden Inn in Solomons Island, Maryland for $11.5 million, excluding closing costs and fees. The purchase was funded with proceeds from the company's first quarter preferred equity capital raise. The company currently is negotiating a mortgage loan for the property, which it expects to complete by year-end.
"While we've only owned the property for two months, we already are seeing a positive impact on our overall portfolio," Walters said. "The hotel has performed to our expectations and continues to hold a substantial market share RevPAR premium over its competitive set. This hotel has multiple, year-round demand generators, and we are quite positive about this acquisition."
Walters noted, "The company is pursuing several other acquisitions with a similar profile: premium-branded, select-service hotels in healthy secondary markets with identifiable and durable sources of business."
Disposition Program
During the 2012 second quarter, the company sold four hotels: a 49-room Super 8 hotel located in El Dorado, Kansas, for $1.6 million, an 87-room Super 8 in Sedalia, Missouri for $1.8 million; a 119-room Super 8 in Wichita, Kansas for $4.1 million; and a 127-room Masters Inn in Tampa, Florida for $2.05 million. Proceeds were used to reduce associated mortgage debt by $7.8 million.
"We continue to average selling a non-core hotel approximately every six to eight weeks," Walters noted. "Financing has eased somewhat, but still takes time for the buyers to obtain. Most of our transactions remain single sales, but we are exploring opportunities for targeted portfolio sales."
Property Renovations
The company invested $1.6 million in property improvements in the 2012 second quarter. "Based on our experience with renovations at similar hotels, while it causes a temporary displacement in revenues, we typically see improved bottom line results through steady RevPAR growth and improved market share," Walters said.
Balance Sheet
"Our balance sheet is stronger now than at any point in the last few years," said Connie Scarpello, chief financial officer. "We have reduced our debt by $32.2 million, or 18.9 percent, in the past 12 months. We will continue to reduce our debt leverage ratios, with a long-term goal of approximately 50 percent debt-to-total enterprise value over time."
Outstanding debt on hotels in continuing operations totaled $117.6 million, and has an average term to maturity of 3.2 years and a weighted average annual interest rate of 6.4 percent.
"We are in negotiations to finance $28.6 million debt mortgage that matures this year," Scarpello said. "We also expect to place a prudent amount of debt on our recently acquired Hilton Garden Inn to free up funds to acquire additional hotels."
"The terms of the preferred capital raise require the company to invest $20 million of equity in hotels meeting the firm's investment criteria, $11.7 million, including acquisition expenses, of which was used to purchase the Hilton Garden Inn in Solomons, Maryland, initially for cash. The remaining $8.3 million was used to pay down the Great Western revolver until other core acquisitions are ready to close which will then involve drawing down on our credit lines as well as using the proceeds from the financing of the Hilton Garden Inn. By year end, the company has plans to invest as much as $40 million in equity and debt as we begin to rebuild our portfolio," Walters said. "We continue to focus on balance sheet improvements through additional de-levering measures."
Subsequent Events
Following the close of the second quarter, the company closed on the sale of its 57-room Super 8 hotel in Watertown, South Dakota for $1.55 million. The associated mortgage debt was fully retired with excess proceeds applied to general corporate purposes.
Dividends
The company did not declare a common stock dividend for the 2012 second quarter. Preferred dividends continued uninterrupted. The company will monitor requirements to maintain its REIT status and will routinely evaluate the dividend policy. The company intends to continue to meet its dividend requirements to retain its REIT status.
Outlook
"We are making steady progress in implementing our business plan," Walters said. "We have made meaningful strides in improving operations, are improving our portfolio make up by selling off non-strategic assets while launching an acquisition program. The weak economic recovery in many markets where we own hotels keeps us cautious, but our dependency on tertiary markets is decreasing steadily as we sell non-core properties. On balance, with proper execution of our business plan, we believe Supertel has a promising future."
About Supertel Hospitality, Inc.
Supertel Hospitality, Inc. (
Forward Looking Statement
Certain matters within this press release are discussed using forward-looking language as specified in the Private Securities Litigation Reform Act of 1995, and, as such, may involve known and unknown risks, uncertainties and other factors that may cause the actual results or performance to differ from those projected in the forward-looking statement. These risks are discussed in the Company's filings with the Securities and Exchange Commission.
| Supertel Hospitality, Inc. | ||||||||||
| Balance Sheet | ||||||||||
| As of June 30, 2012, and December 31, 2011 | ||||||||||
| (dollars in thousands, except share and per share data) | ||||||||||
| The Company owned 95 hotels (including 20 hotels in discontinued operations) at June 30, 2012, and 105 hotels as of December 31, 2011 respectively. | ||||||||||
| As of | ||||||||||
| June 30, | December 31, | |||||||||
| 2012 | 2011 | |||||||||
| (unaudited) | ||||||||||
| ASSETS | ||||||||||
| Investments in hotel properties | $ | 263,534 | $ | 255,677 | ||||||
| Less accumulated depreciation | 78,326 | 76,777 | ||||||||
| 185,208 | 178,900 | |||||||||
| Cash and cash equivalents | 1,167 | 279 | ||||||||
| Accounts receivable, net of allowance for doubtful accounts of $194 and $194 | 2,808 | 1,891 | ||||||||
| Prepaid expenses and other assets | 10,287 | 8,917 | ||||||||
| Deferred financing costs, net | 709 | 850 | ||||||||
| Investment in hotel properties, held for sale, net | 22,121 | 30,335 | ||||||||
| $ | 222,300 | $ | 221,172 | |||||||
| LIABILITIES AND EQUITY | ||||||||||
| LIABILITIES | ||||||||||
| Accounts payable, accrued expenses and other liabilities | $ | 13,051 | $ | 10,704 | ||||||
| Derivative liabilities, at fair value | 16,035 | - | ||||||||
| Debt related to hotel properties held for sale | 20,824 | 35,173 | ||||||||
| Long-term debt | 117,625 | 130,672 | ||||||||
| 167,535 | 176,549 | |||||||||
| Redeemable noncontrolling interest in consolidated partnership, at redemption value | 114 | 114 | ||||||||
| Redeemable preferred stock | ||||||||||
| 10% Series B, 800,000 shares authorized; $.01 par value, 332,500 shares outstanding, liquidation preference of $8,312 | 7,662 |
7,662 |
||||||||
| EQUITY | ||||||||||
| Shareholders' equity | ||||||||||
| Preferred stock, 40,000,000 shares authorized; 8% Series A, 2,500,000 shares authorized, $.01 par value, 803,270 shares outstanding, liquidation preference of $8,033 | 8 |
8 |
||||||||
| 6.25% Series C, 3,000,000 shares authorized, $.01 par value, 3,000,000 shares outstanding, liquidation preference of $30,000 | 30 |
- |
||||||||
| Common stock, $.01 par value, 200,000,000 shares authorized; 23,128,477 and 23,070,387 shares outstanding | 231 |
231 |
||||||||
| Common stock warrants | 252 | 252 | ||||||||
| Additional paid-in capital | 134,762 | 121,619 | ||||||||
| Distributions in excess of retained earnings | (88,425 | ) | (85,398 | ) | ||||||
| Total shareholders' equity | 46,858 | 36,712 | ||||||||
| Noncontrolling interest | ||||||||||
| Noncontrolling interest in consolidated partnership, redemption value $92 and $64 | 131 |
135 |
||||||||
| Total equity | 46,989 | 36,847 | ||||||||
| COMMITMENTS AND CONTINGENCIES | ||||||||||
| $ | 222,300 | $ | 221,172 | |||||||
| Supertel Hospitality, Inc. | |||||||||||||||||
| Results of Operations | |||||||||||||||||
| For the three and six months ended June 30, 2012 and 2011, respectively | |||||||||||||||||
| (Unaudited-Dollars in thousands, except per share data) | |||||||||||||||||
| Three Months Ended | Six Months Ended | ||||||||||||||||
| June 30, | June 30, | ||||||||||||||||
| 2012 | 2011 | 2012 | 2011 | ||||||||||||||
| REVENUES | |||||||||||||||||
| Room rentals and other hotel services | $ | 21,562 | $ | 20,433 | $ | 38,243 | $ | 36,703 | |||||||||
| EXPENSES | |||||||||||||||||
| Hotel and property operations | 15,269 | 14,878 | 28,810 | 28,366 | |||||||||||||
| Depreciation and amortization | 2,226 | 2,313 | 4,350 | 4,559 | |||||||||||||
| General and administrative | 921 | 1,001 | 2,014 | 2,104 | |||||||||||||
| Acquisition expense | 162 | - | 162 | 1 | |||||||||||||
| Termination cost | - | - | - | 540 | |||||||||||||
| 18,578 | 18,192 | 35,336 | 35,570 | ||||||||||||||
| EARNINGS BEFORE NET LOSS ON DISPOSITIONS OF ASSETS, OTHER INCOME, INTEREST EXPENSE AND INCOME TAXES | 2,984 |
2,241 |
2,907 |
1,133 |
|||||||||||||
| Net loss on dispositions of assets | (4 | ) | (8 | ) | (7 | ) | (14 | ) | |||||||||
| Other income (expense) | 872 | 20 | (341 | ) | 105 | ||||||||||||
| Interest expense | (2,057 | ) | (2,147 | ) | (4,173 | ) | (4,482 | ) | |||||||||
| Impairment | (4,096 | ) | (4,198 | ) | (3,714 | ) | (4,392 | ) | |||||||||
| LOSS FROM CONTINUING OPERATIONS BEFORE INCOME TAXES | (2,301 |
) | (4,092 |
) | (5,328 |
) | (7,650 |
) | |||||||||
| Income tax (expense) benefit | (353 | ) | (97 | ) | 111 | 512 | |||||||||||
| LOSS FROM CONTINUING OPERATIONS | (2,654 | ) | (4,189 | ) | (5,217 | ) | (7,138 | ) | |||||||||
| Gain (loss) from discontinued operations, net of tax | 5,094 | 77 | 3,686 | (685 | ) | ||||||||||||
| NET INCOME (LOSS) | 2,440 | (4,112 | ) | (1,531 | ) | (7,823 | ) | ||||||||||
| Noncontrolling interest | (8 | ) | 3 | (2 | ) | 14 | |||||||||||
| NET INCOME (LOSS) ATTRIBUTABLE TO CONTROLLING INTERESTS | 2,432 | (4,109 | ) | (1,533 | ) | (7,809 | ) | ||||||||||
| Preferred stock dividends | (837 | ) | (369 | ) | (1,494 | ) | (737 | ) | |||||||||
| NET INCOME (LOSS) ATTRIBUTABLE TO COMMON SHAREHOLDERS | $ | 1,595 |
$ | (4,478 |
) | $ | (3,027 |
) | $ | (8,546 |
) | ||||||
| NET INCOME (LOSS) PER COMMON SHARE - BASIC AND DILUTED | |||||||||||||||||
| EPS from continuing operations | $ | (0.15 | ) | $ | (0.20 | ) | $ | (0.29 | ) | $ | (0.34 | ) | |||||
| EPS from discontinued operations | $ | 0.22 | $ | - | $ | 0.16 | $ | (0.03 | ) | ||||||||
| EPS basic and diluted | $ | 0.07 | $ | (0.20 | ) | $ | (0.13 | ) | $ | (0.37 | ) | ||||||
RECONCILIATION OF NON-GAAP FINANCIAL MEASURES
FFO and AFFO
FFO and Adjusted FFO ("AFFO") are non-GAAP financial measures. We consider FFO and AFFO to be market accepted measures of an equity REIT's operating performance, which are necessary, along with net earnings (loss), for an understanding of our operating results. FFO, as defined under the National Association of Real Estate Investment Trusts (NAREIT) standards, consists of net income computed in accordance with GAAP, excluding gains (or losses) from sales of real estate assets, plus depreciation and amortization of real estate assets. We believe our method of calculating FFO complies with the NAREIT definition. AFFO is FFO adjusted to include gain or exclude losses on derivative liabilities, which is a non-cash charge against income and which does not represent results from our core operations. AFFO also adds back acquisition costs. FFO and AFFO do not represent amounts available for management's discretionary use because of needed capital replacement or expansion, debt service obligations, or other commitments and uncertainties. FFO and AFFO should not be considered as alternatives to net income (loss) (computed in accordance with GAAP) as an indicator of our liquidity, nor are they indicative of funds available to fund our cash needs, including our ability to pay dividends or make distributions. All REITs do not calculate FFO and AFFO in the same manner; therefore, our calculation may not be the same as the calculation of FFO and AFFO for similar REITs.
Diluted FFO per share and diluted Adjusted FFO per share are computed after adjusting the numerator and denominator of the basic computation for the effects of any dilutive potential common shares outstanding during the period. Up to 30,000,000 shares of common stock may be issued upon conversion of the Series C convertible preferred stock, and adjustments are made for these shares in the computation of diluted FFO per share and diluted Adjusted FFO per share. The Company's outstanding warrants to purchase common stock and stock options would be antidilutive and are not included in the dilution computation.
We use FFO and AFFO as performance measures to facilitate a periodic evaluation of our operating results relative to those of our peers. We consider FFO and AFFO to be useful additional measures of performance for an equity REIT because it facilitates an understanding of the operating performance of our properties without giving effect to real estate depreciation and amortization, which assume that the value of real estate assets diminishes predictably over time. Since real estate values have historically risen or fallen with market conditions, we believe that FFO and AFFO provide a meaningful indication of our performance.
(Unaudited-In thousands, except per share data)
| Three months | Six Months | ||||||||||||||||
| ended June 30, | ended June 30, | ||||||||||||||||
| 2012 | 2011 | 2012 | 2011 | ||||||||||||||
| RECONCILIATION OF NET INCOME (LOSS) TO FFO | |||||||||||||||||
| Net income (loss) attributable to common shareholders | $ | 1,595 | $ | (4,478 | ) | $ | (3,027 | ) | $ | (8,546 | ) | ||||||
| Depreciation and amortization | 2,226 | 2,643 | 4,396 | 5,263 | |||||||||||||
| Net gain on disposition of assets | (4,772 | ) | (354 | ) | (5,263 | ) | (335 | ) | |||||||||
| Impairment | 4,083 | 4,813 | 5,517 | 5,262 | |||||||||||||
| FFO available to common shareholders | $ | 3,132 | $ | 2,624 | $ | 1,623 | $ | 1,644 | |||||||||
| Unrealized (gain) loss on derivatives | (867 | ) | - | 346 | - | ||||||||||||
| Acquisition expense | 162 | - | 162 | 1 | |||||||||||||
| Adjusted FFO | $ | 2,427 | $ | 2,624 | $ | 2,131 | $ | 1,645 | |||||||||
| FFO available to common shareholders | $ | 3,132 | $ | 2,624 | $ | 1,623 | $ | 1,644 | |||||||||
| Dividends paid on Series C convertible preferred stock | 469 | - | 758 | - | |||||||||||||
| FFO for FFO per share - diluted | $ | 3,601 | $ | 2,624 | $ | 2,381 | $ | 1,644 | |||||||||
| Adjusted FFO available to common shareholders | $ | 2,427 | $ | 2,624 | $ | 2,131 | $ | 1,645 | |||||||||
| Dividends paid on Series C convertible preferred stock | 469 | - | 758 | - | |||||||||||||
| Adjusted FFO for Adjusted FFO per share - diluted | $ | 2,896 | $ | 2,624 | $ | 2,889 | $ | 1,645 | |||||||||
| Weighted average shares outstanding for: | |||||||||||||||||
| calculation of FFO per share - basic | 23,075 | 22,964 | 23,073 | 22,941 | |||||||||||||
| calculation of FFO per share - diluted | 53,075 | 22,964 | 47,271 | 22,941 | |||||||||||||
| FFO per share - basic | $ | 0.14 | $ | 0.11 | $ | 0.07 | $ | 0.07 | |||||||||
| Adjusted FFO per share - basic | $ | 0.11 | $ | 0.11 | $ | 0.09 | $ | 0.07 | |||||||||
| FFO per share - diluted | $ | 0.07 | $ | 0.11 | $ | 0.05 | $ | 0.07 | |||||||||
| Adjusted FFO per share - diluted | $ | 0.05 | $ | 0.11 | $ | 0.06 | $ | 0.07 | |||||||||
EBITDA and Adjusted EBITDA
EBITDA and Adjusted EBITDA are financial measures that are not calculated in accordance with accounting principles generally accepted in the United States of America ("GAAP"). We calculate EBITDA and Adjusted EBITDA by adding back to net earnings (loss) available to common shareholders certain non-operating expenses and non-cash charges which are based on historical cost accounting and we believe may be of limited significance in evaluating current performance. We believe these adjustments can help eliminate the accounting effects of depreciation and amortization and financing decisions and facilitate comparisons of core operating profitability between periods, even though EBITDA and Adjusted EBITDA also do not represent an amount that accrues directly to common shareholders. In calculating Adjusted EBITDA, we add back noncontrolling interest, net (gain) loss on disposition of assets, preferred stock dividends and acquisition expenses which are cash charges. We also add back impairment and unrealized gain or loss on derivatives, which are non-cash charges.
EBITDA and Adjusted EBITDA do not represent cash generated from operating activities determined by GAAP and should not be considered as alternatives to net income, cash flow from operations or any other operating performance measure prescribed by GAAP. EBITDA and Adjusted EBITDA are not measures of our liquidity, nor are they indicative of funds available to fund our cash needs, including our ability to make cash distributions. Neither do the measurements reflect cash expenditures for long-term assets and other items that have been and will be incurred. EBITDA and Adjusted EBITDA may include funds that may not be available for management's discretionary use due to functional requirements to conserve funds for capital expenditures, property acquisitions, and other commitments and uncertainties. To compensate for this, management considers the impact of these excluded items to the extent they are material to operating decisions or the evaluation of our operating performance. Adjusted EBITDA, as presented, may not be comparable to similarly titled measures of other companies.
(Unaudited-In thousands, except statistical data)
| Three months | Six months | ||||||||||||||||
| ended June 30, | ended June 30, | ||||||||||||||||
| 2012 | 2011 | 2012 | 2011 | ||||||||||||||
| RECONCILIATION OF NET INCOME (LOSS) TO ADJUSTED EBITDA | |||||||||||||||||
| Net income (loss) attributable to common shareholders | $ | 1,595 | $ | (4,478 | ) | $ | (3,027 | ) | $ | (8,546 | ) | ||||||
| Interest expense, including discontinued operations | 2,549 | 2,862 | 5,227 | 5,964 | |||||||||||||
| Income tax expense (benefit), including discontinued operations | 354 | (55 | ) | (308 | ) | (1,127 | ) | ||||||||||
| Depreciation and amortization, including discontinued operations | 2,226 | 2,643 | 4,396 | 5,263 | |||||||||||||
| EBITDA | 6,724 | 972 | 6,288 | 1,554 | |||||||||||||
| Noncontrolling interest | 8 | (3 | ) | 2 | (14 | ) | |||||||||||
| Net gain on disposition of assets | (4,772 | ) | (354 | ) | (5,263 | ) | (335 | ) | |||||||||
| Impairment | 4,083 | 4,813 | 5,517 | 5,262 | |||||||||||||
| Preferred stock dividend | 837 | 369 | 1,494 | 737 | |||||||||||||
| Unrealized (gain) loss on derivatives | (867 | ) | - | 346 | - | ||||||||||||
| Acquisition expense | 162 | - | 162 | 1 | |||||||||||||
| ADJUSTED EBITDA | $ | 6,175 | $ | 5,797 | $ | 8,546 | $ | 7,205 | |||||||||
| Supertel Hospitality, Inc. | |||||||||||||||||||
| Operating Statistics by Chain Scale Classification - Hotels in Continuing Operations | |||||||||||||||||||
| For the three and six months ended June 30, 2012 and 2011, respectively | |||||||||||||||||||
| (Unaudited - In thousands, except per share data) | |||||||||||||||||||
| Three months | Six months | ||||||||||||||||||
| ended June 30, | ended June 30, | ||||||||||||||||||
| 2012 | 2011 | 2012 | 2011 | ||||||||||||||||
| Same Store:* | |||||||||||||||||||
| Revenue per available room (RevPAR): | |||||||||||||||||||
| Upper Midscale | $ | 51.95 | $ | 49.51 | $ | 46.03 | $ | 42.99 | |||||||||||
| Midscale | $ | 36.68 | $ | 30.24 | $ | 32.27 | $ | 29.00 | |||||||||||
| Economy | $ | 33.54 | $ | 33.07 | $ | 29.48 | $ | 29.65 | |||||||||||
| Extended Stay | $ | 17.72 | $ | 17.37 | $ | 17.63 | $ | 17.69 | |||||||||||
| Total | $ | 35.69 | $ | 34.34 | $ | 31.82 | $ | 30.92 | |||||||||||
| Average daily room rate (ADR): | |||||||||||||||||||
| Upper Midscale | $ | 72.99 | $ | 71.23 | $ | 69.85 | $ | 68.63 | |||||||||||
| Midscale | $ | 64.83 | $ | 63.53 | $ | 62.66 | $ | 61.43 | |||||||||||
| Economy | $ | 50.47 | $ | 49.46 | $ | 49.25 | $ | 48.16 | |||||||||||
| Extended Stay | $ | 24.71 | $ | 23.75 | $ | 24.55 | $ | 23.61 | |||||||||||
| Total | $ | 52.54 | $ | 50.98 | $ | 50.57 | $ | 48.92 | |||||||||||
| Occupancy percentage: | |||||||||||||||||||
| Upper Midscale | 71.2 | % | 69.5 | % | 65.9 | % | 62.6 | % | |||||||||||
| Midscale | 56.6 | % | 47.6 | % | 51.5 | % | 47.2 | % | |||||||||||
| Economy | 66.5 | % | 66.9 | % | 59.9 | % | 61.6 | % | |||||||||||
| Extended Stay | 71.7 | % | 73.1 | % | 71.8 | % | 74.9 | % | |||||||||||
| Total | 67.9 | % | 67.4 | % | 62.9 | % | 63.2 | % | |||||||||||
*Same store reflects 74 hotels.
| Supertel Hospitality, Inc. | |||||||||||||||||
| Property Operating Income (POI) - Continuing and Discontinued Operations | |||||||||||||||||
| Note: This presentation includes non-GAAP financial measures. The Company believes that the presentation of hotel property operating income (POI) is helpful to investors, and represents a useful description of its operations, as it communicates the comparability of its hotels' operating results. | |||||||||||||||||
| Unaudited-In thousands, except statistical data: | Three months | Six months | |||||||||||||||
| ended June 30, | ended June 30, | ||||||||||||||||
| 2012 | 2011 | 2012 | 2011 | ||||||||||||||
| Total Same Store Hotels (74 hotels): | |||||||||||||||||
| Revenue per available room (RevPAR): | $ | 35.69 | $ | 34.34 | $ | 31.82 | $ | 30.92 | |||||||||
| Average daily room rate (ADR): | $ | 52.54 | $ | 50.98 | $ | 50.57 | $ | 48.92 | |||||||||
| Occupancy percentage: | 67.9 | % | 67.4 | % | 62.9 | % | 63.2 | % | |||||||||
| Continuing Operations | |||||||||||||||||
| Revenue from room rentals and other hotel services consists of: | |||||||||||||||||
| Room rental revenue | $ | 20,927 | $ | 19,854 | $ | 37,084 | $ | 35,560 | |||||||||
| Telephone revenue | 71 | 75 | 148 | 146 | |||||||||||||
| Other hotel service revenues | 564 | 504 | 1,011 | 997 | |||||||||||||
| Total revenue from room rentals and other hotel services | $ | 21,562 | $ | 20,433 | $ | 38,243 | $ | 36,703 | |||||||||
| Hotel and property operations expense | |||||||||||||||||
| Total hotel and property operations expense | $ | 15,269 | $ | 14,878 | $ | 28,810 | $ | 28,366 | |||||||||
| Property Operating Income ("POI") from Continuing Operations | |||||||||||||||||
| Total POI - continuing operations | $ | 6,293 | $ | 5,555 | $ | 9,433 | $ | 8,337 | |||||||||
| POI - continuing operations as a percentage of revenue from room rentals and other hotel services | |||||||||||||||||
| POI - continuing operations as a percentage of revenue | 29.2 | % | 27.2 | % | 24.7 | % | 22.7 | % | |||||||||
| Discontinued Operations | |||||||||||||||||
| Room rentals and other hotel services | |||||||||||||||||
| Total room rental and other hotel services | $ | 4,847 | $ | 6,314 | $ | 9,036 | $ | 11,619 | |||||||||
| Hotel and property operations expense | |||||||||||||||||
| Total hotel and property operations expense | $ | 4,049 | $ | 5,091 | $ | 7,914 | $ | 10,162 | |||||||||
| Property Operating Income ("POI") from discontinued operations | |||||||||||||||||
| POI - discontinued operations | $ | 798 | $ | 1,223 | $ | 1,122 | $ | 1,457 | |||||||||
| POI - discontinued operations as a percentage of revenue from room rentals and other hotel services | |||||||||||||||||
| POI - discontinued operations as a percentage of revenue | 16.5 | % | 19.4 | % | 12.4 | % | 12.5 | % | |||||||||
| Three months | Six months | ||||||||||||||||
| ended June 30 | ended June 30 | ||||||||||||||||
| 2012 | 2011 | 2012 | 2011 | ||||||||||||||
| Reconciliation of net loss from continuing operations to POI from continuing operations | |||||||||||||||||
| Net loss from continuing operations | $ | (2,654 | ) | $ | (4,189 | ) | $ | (5,217 | ) | $ | (7,138 | ) | |||||
| Depreciation and amortization | 2,226 | 2,313 | 4,350 | 4,559 | |||||||||||||
| Net loss on disposition of assets | 4 | 8 | 7 | 14 | |||||||||||||
| Other (income) expense | (872 | ) | (20 | ) | 341 | (105 | ) | ||||||||||
| Interest expense | 2,057 | 2,147 | 4,173 | 4,482 | |||||||||||||
| General and administrative expense | 921 | 1,001 | 2,014 | 2,104 | |||||||||||||
| Acquisition, termination expense | 162 | - | 162 | 1 | |||||||||||||
| Termination cost | - | - | - | 540 | |||||||||||||
| Income tax (benefit) expense | 353 | 97 | (111 | ) | (512 | ) | |||||||||||
| Impairment expense | 4,096 | 4,198 | 3,714 | 4,392 | |||||||||||||
| POI - continuing operations | $ | 6,293 | $ | 5,555 | $ | 9,433 | $ | 8,337 | |||||||||
| Net income (loss) as a percentage of continuing operations revenue from room rentals and other hotel services | -12.3 |
% | -20.5 |
% | -13.6 |
% | -19.4 |
% | |||||||||
| Reconciliation of loss from discontinued operations to POI from discontinued operations: | Three months ended June 30, |
Six months ended June 30, |
||||||||||||||
| 2012 | 2011 | 2012 | 2011 | |||||||||||||
| Gain (loss) from discontinued operations | $ | 5,094 | $ | 77 | $ | 3,686 | $ | (685 | ) | |||||||
| Depreciation and amortization from discontinued operations | - | 330 | 46 | 704 | ||||||||||||
| Net gain on disposition of assets from discontinued operations | (4,776 | ) | (362 | ) | (5,270 | ) | (349 | ) | ||||||||
| Interest expense from discontinued operations | 492 | 715 | 1,054 | 1,482 | ||||||||||||
| General and administrative expense from discontinued operations | - | - | - | 50 | ||||||||||||
| Impairment losses from discontinued operations | (13 | ) | 615 | 1,803 | 870 | |||||||||||
| Income tax benefit from discontinued operations | 1 | (152 | ) | (197 | ) | (615 | ) | |||||||||
| POI - discontinued operations | $ | 798 | $ | 1,223 | $ | 1,122 | $ | 1,457 | ||||||||
| Reconciliation of Total POI: | Three months | Six months | ||||||||||||||
| ended June 30, | ended June 30, | |||||||||||||||
| 2012 | 2011 | 2012 | 2011 | |||||||||||||
| POI - Continuing operations | 6,293 | 5,555 | 9,433 | 8,337 | ||||||||||||
| POI - Discontinued operations | 798 | 1,223 | 1,122 | 1,457 | ||||||||||||
| Total - POI | $ | 7,091 | $ | 6,778 | $ | 10,555 | $ | 9,794 | ||||||||
| Total POI as a percentage of revenues | 26.9 | % | 25.3 | % | 22.3 | % | 20.3 | % | ||||||||
| Supertel Hospitality, Inc. | |||||||||||||||||||
| Operating Statistics by Region | |||||||||||||||||||
| For the three months ended June 30, 2012 and 2011, respectively | |||||||||||||||||||
| (Unaudited - In thousands, except per share data) | |||||||||||||||||||
| The comparisons of same store operations are for 74 hotels in continuing operations as of April 1, 2011. | |||||||||||||||||||
| Three months ended June 30, 2012 | Three months ended June 30, 2011 | ||||||||||||||||||
| Room | Room | ||||||||||||||||||
| Region | Count | RevPAR | Occupancy | ADR | Count | RevPAR | Occupancy | ADR | |||||||||||
| Mountain | 214 | $ | 40.06 | 77.8% | $ | 51.47 | 214 | $ | 35.03 | 69.2% | $ | 50.60 | |||||||
| West North Central | 1,559 | 36.13 | 69.9% | 51.65 | 1,559 | 33.71 | 67.4% | 50.04 | |||||||||||
| East North Central | 978 | 37.78 | 61.1% | 61.88 | 978 | 37.78 | 61.4% | 61.51 | |||||||||||
| Middle Atlantic | 142 | 51.10 | 82.0% | 62.33 | 142 | 47.62 | 79.9% | 59.63 | |||||||||||
| South Atlantic | 2,525 | 32.66 | 69.4% | 47.05 | 2,525 | 31.66 | 69.7% | 45.43 | |||||||||||
| East South Central | 563 | 46.03 | 68.2% | 67.52 | 563 | 41.20 | 61.9% | 66.52 | |||||||||||
| West South Central | 373 | 24.31 | 55.4% | 43.89 | 373 | 30.26 | 69.4% | 43.57 | |||||||||||
| Total Same Store (74 hotels) | 6,354 | $ | 35.69 | 67.9% | $ | 52.54 | 6,354 | $ | 34.34 | 67.4% | $ | 50.98 | |||||||
| South Atlantic Acquisitions | 100 | $ | 93.04 | 73.8% | $ | 126.05 | - | $ | - | 0.0% | $ | - | |||||||
| Total Acquisitions | 100 | $ | 93.04 | 73.8% | $ | 126.05 | - | $ | - | 0.0% | $ | - | |||||||
| Total | 6,454 | $ | 36.05 | 68.0% | $ | 53.05 | 6,354 | $ | 34.34 | 67.4% | $ | 50.98 | |||||||
| States included in the Regions | |||||||||||||||||||
| Mountain | Idaho and Montana | ||||||||||||||||||
| West North Central | Iowa, Kansas, Missouri, Nebraska and South Dakota | ||||||||||||||||||
| East North Central | Indiana and Wisconsin | ||||||||||||||||||
| Middle Atlantic | Pennsylvania | ||||||||||||||||||
| South Atlantic | Delaware, Florida, Georgia, Maryland, North Carolina, South Carolina, Virginia and West Virginia | ||||||||||||||||||
| East South Central | Kentucky and Tennessee | ||||||||||||||||||
| West South Central | Arkansas and Louisiana | ||||||||||||||||||
| Supertel Hospitality, Inc. | |||||||||||||||||||
| Operating Statistics by Region | |||||||||||||||||||
| For the six months ended June 30, 2012 and 2011, respectively | |||||||||||||||||||
| (Unaudited - In thousands, except per share data) | |||||||||||||||||||
| The comparisons of same store operations are for 74 hotels in continuing operations as of January 1, 2011. | |||||||||||||||||||
| Six months ended June 30, 2012 | Six months ended June 30, 2011 | ||||||||||||||||||
| Room | Room | ||||||||||||||||||
| Region | Count | RevPAR | Occupancy | ADR | Count | RevPAR | Occupancy | ADR | |||||||||||
| Mountain | 214 | $ | 32.78 | 65.8% | $ | 49.79 | 214 | $ | 29.22 | 60.8% | $ | 48.06 | |||||||
| West North Central | 1,559 | 30.64 | 60.9% | 50.27 | 1,559 | 29.61 | 61.2% | 48.37 | |||||||||||
| East North Central | 978 | 33.39 | 55.6% | 60.01 | 978 | 33.16 | 55.5% | 59.76 | |||||||||||
| Middle Atlantic | 142 | 42.86 | 71.9% | 59.62 | 142 | 39.62 | 69.9% | 56.71 | |||||||||||
| South Atlantic | 2,525 | 30.57 | 67.9% | 45.03 | 2,525 | 29.48 | 68.3% | 43.19 | |||||||||||
| East South Central | 563 | 39.67 | 60.1% | 65.99 | 563 | 36.59 | 55.8% | 65.61 | |||||||||||
| West South Central | 373 | 24.19 | 55.6% | 43.55 | 373 | 29.36 | 67.5% | 43.47 | |||||||||||
| Total Same Store (74 hotels) | 6,354 | $ | 31.82 | 62.9% | $ | 50.57 | 6,354 | $ | 30.92 | 63.2% | $ | 48.92 | |||||||
| South Atlantic Acquisitions | 100 | $ | 93.04 | 73.8% | $ | 126.05 | - | $ | - | 0.0% | $ | - | |||||||
| Total Acquisitions | 100 | $ | 93.04 | 73.8% | $ | 126.05 | - | $ | - | 0.0% | $ | - | |||||||
| Total | 6,454 | $ | 32.01 | 63.0% | $ | 50.85 | 6,354 | $ | 30.92 | 63.2% | $ | 48.92 | |||||||
| States included in the Regions | |||||||||||||||||||
| Mountain | Idaho and Montana | ||||||||||||||||||
| West North Central | Iowa, Kansas, Missouri, Nebraska and South Dakota | ||||||||||||||||||
| East North Central | Indiana and Wisconsin | ||||||||||||||||||
| Middle Atlantic | Pennsylvania | ||||||||||||||||||
| South Atlantic | Delaware, Florida, Georgia, Maryland, North Carolina, South Carolina, Virginia and West Virginia | ||||||||||||||||||
| East South Central | Kentucky and Tennessee | ||||||||||||||||||
| West South Central | Arkansas and Louisiana | ||||||||||||||||||
Note: During the reporting periods above, no properties were moved from the same store portfolio and reclassified as held for sale and no properties which were included in discontinued operations (held for sale) were reclassified as held for use.
Contact Information:
Contact:
Ms. Krista Arkfeld
Director of Corporate Communications
karkfeld@supertelinc.com