MANISTIQUE, MI--(Marketwire - Feb 5, 2013) - Mackinac Financial Corporation (
Total assets of the Corporation at 2012 year-end were $545.980 million, up 9.57% from the $498.311 million at 2011 year-end. The Corporation and the Bank are both "well-capitalized" with Tier 1 Capital at the Corporation of 11.98% and 9.63% at the Bank.
Some highlights for 2012 include:
- Consummation of a common stock rights offering and the investment by Steinhardt Capital Investors, LLLP with the issuance of 2.140 million shares for net proceeds of $11.500 million.
- In December, the Corporation announced its first quarterly dividend since the recapitalization at $.04 per share.
- New loan production of $214.1 million. Balance sheet growth equated to $47.9 million for 2012, an 11.9% increase in loans outstanding from 2011 year end.
- 2012 secondary mortgage loan income of $1.390 million, compared to $.700 million in 2011.
- Continued success with the sale of SBA and USDA loan guarantees with sales generating $1.126 million in 2012.
- 2012 core deposit growth of $24 million from 2011 year end, an increase of 6.8%.
- Improved net interest margin at 4.17% compared to 4.06% in 2011.
- Improved credit quality with a Texas Ratio of 10.30% compared to 18.43% one year ago, with nonperforming assets of $8.001 million at 2012 year end compared to $11.155 million a year ago.
- Opening of our new standalone Escanaba branch banking center relocated from an in-store Menards location in August, and the opening of our new loan production office in Traverse City. Both locations are considered core commerce center hubs in their respective markets.
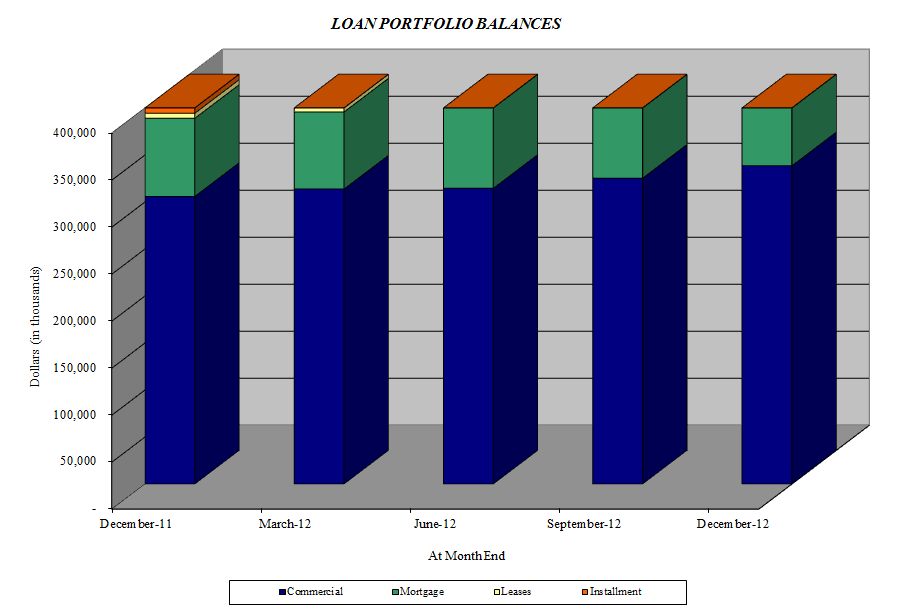
Loan Production
Total loans at 2012 year-end were $449.177 million, an 11.95% increase from the $401.246 million at 2011 year-end. The Corporation had total loan production for all loan types of $214 million in 2012. Comprising the total production were $103 million in commercial loans, and $111 million in consumer loans, $101 million of which were mortgages. The Upper Peninsula continues to drive a large majority of the new originations, totaling $134 million, with Southeast Michigan production of $42 million, and the Northern Lower Peninsula with $38 million. Commenting on new loan opportunities, Kelly W. George, President and Chief Executive Officer of mBank, stated, "We were extremely pleased with our success in loan production in 2012. Our loan production was all encompassing, including new home purchases and refinances, small business expansion and working capital advances, and also included loan relationships we procured from our competition. We continue to see good loan opportunities, both commercial and retail in all our markets. Our focus on SBA/USDA lending programs has allowed small businesses in our markets to take advantage of these loan programs to garner the additional capital they have needed to grow their operations and provide more jobs and commerce to these areas. We continue to remain very diligent within our credit underwriting parameters to ensure the new growth is coming onto our balance sheet in a prudent and sound manner with discipline in both loan structuring and pricing. In addition to the $449 million in balance sheet loans, we also have $50 million of SBA/USDA loans and $97 million of secondary market mortgage loans that we sold but retained servicing on. This increases our loans under management to $596 million."
Secondary Market Mortgage Lending
The Corporation made a concentrated effort several years ago to augment this line of business through some key personnel additions and technology enhancements. These efforts were well rewarded, with production of $74.1 million in secondary market mortgage loans compared to $39.0 million in 2011. Gains and fees from secondary mortgage activity totaled $1.390 million in 2012 compared to $.700 million in 2011. In addition, the Corporation also received $.179 million in fees on its secondary market servicing portfolio.
SBA/USDA Program Lending
The Corporation continues to have success in this line of business as in years past with 2012 gains from sales of SBA/USDA guaranteed loan balances amounting to $1.176 million compared to $1.500 million in 2011. The guaranteed SBA/USDA loan balances sold totaled $11.962 million for 2012, compared to $23.806 million in 2011. The Bank also services approximately $50 million of SBA/USDA loans which generated an additional $.374 million in fees during 2012. The Corporation remains a state leader in the origination of these government lending programs.
Nonperforming Loans / Assets
Nonperforming loans totaled $4.789 million, 1.07% of total loans at December 31, 2012 compared to $7.993 million, or 1.99% of total loans at December 31, 2011. Nonperforming assets were reduced by $3.154 million from a year ago and stood at $8.001 million, or 1.47% of total assets. George, commenting on credit quality, stated, "We have continued to aggressively remedy or exit our remaining problem assets throughout the year and are pleased with our continued reduction in the level of nonperforming assets and our overall loan portfolio payment performance with delinquent loans greater than 30 days residing at a nominal .73% of total loans. Our current level of nonperforming assets and associated costs are now more in line with a normal business climate and we continue to validate the underlying collateral to ensure the security has not deteriorated and carrying values are accurate."
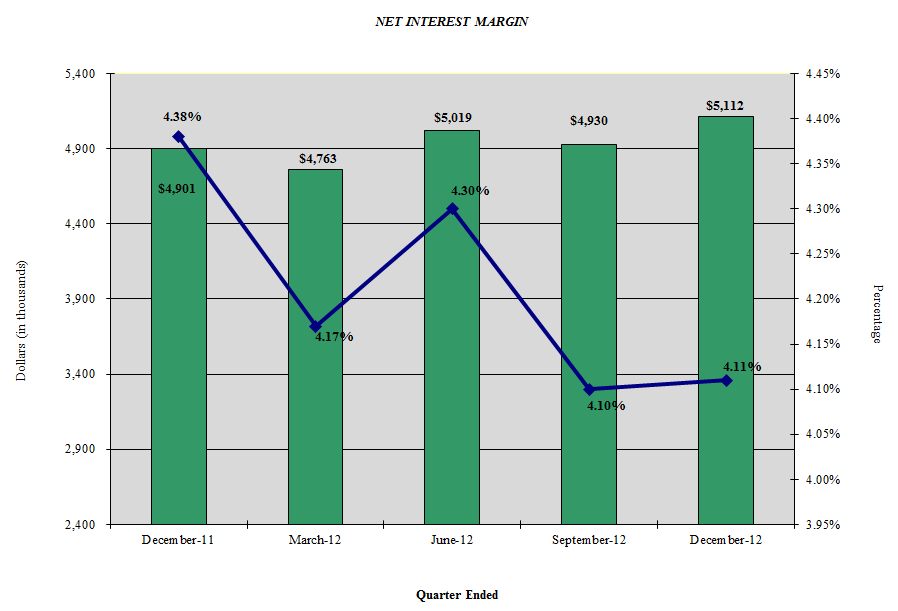
Margin Analysis
Net interest income and the net interest margin in 2012 increased to $19.824 million, and 4.17%, compared to $17.929 million, and 4.06%, in 2011. The interest margin increase was largely due to decreased funding costs. George, commenting on the margin, stated, "We expect some margin pressure in future periods from a national economic policy that fosters a low interest rate environment and remain proactive in managing both the asset and the liability side of the balance sheet to mitigate the downward pressure. This interest rate environment has also limited investment options and puts pressure on our loan portfolio yields in this prolonged economic cycle. Our challenge is to continue growing our loan portfolio with a good balance of fixed and variable rate loans, structured to mitigate long-term interest rate risk when an upward interest rate movement begins to occur."
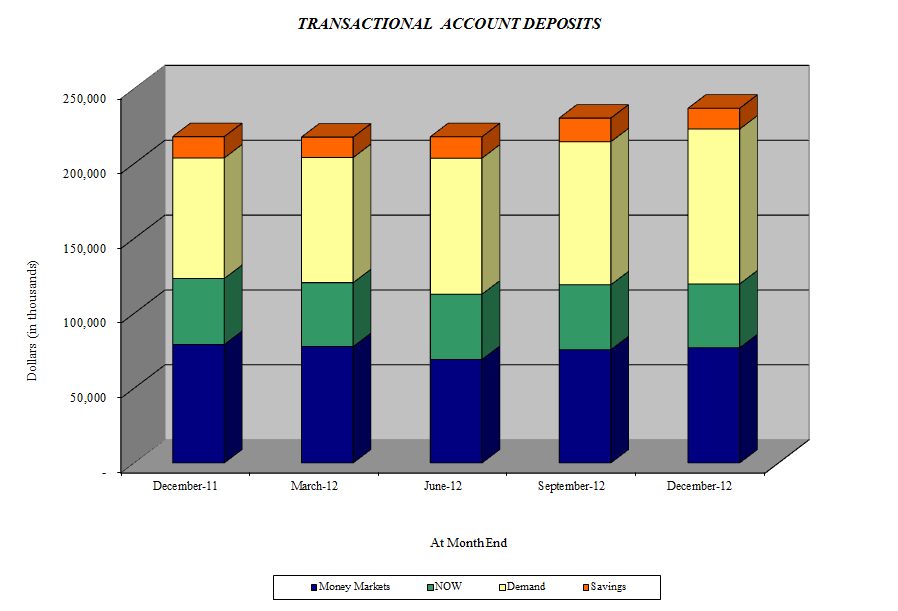
Deposits
Total deposits of $434.557 million at 2012 year-end increased 11.64% from deposits of $404.789 million at 2011 year-end. The overall increase in deposits for 2012 is comprised of an increase in core deposits of $23.772 million and increased noncore deposits of $5.996 million. George, commenting on core deposits, stated, "In 2012 we experienced continued good core deposit growth, though lower than in previous years, partially due to proactive rate reductions on deposit products that led to some balance reductions from strictly price driven non-relationship deposit customers. Our balance sheet liquidity was strong throughout 2012, and we were able to fund the majority of our balance sheet growth with core deposits."
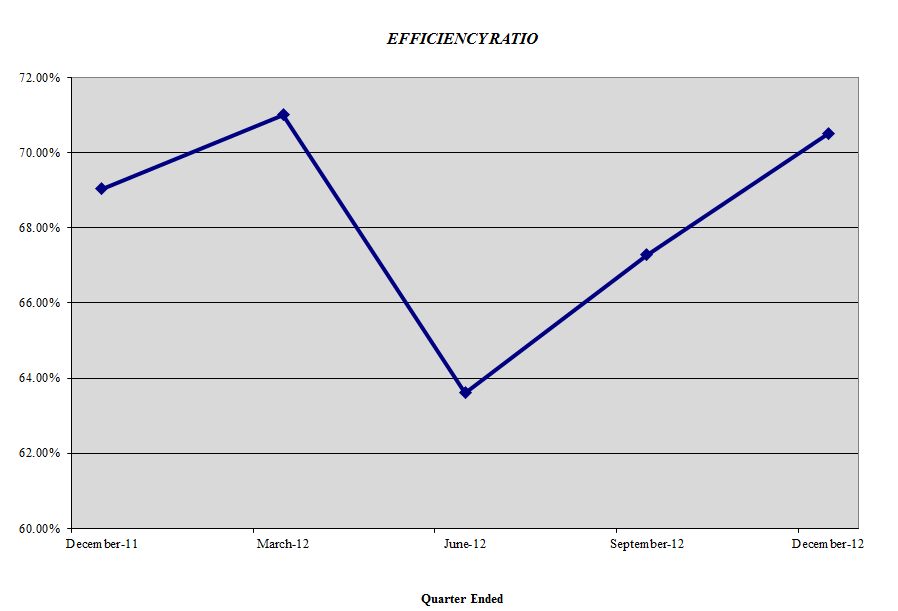
Noninterest Income/Expense
Noninterest income, at $4.043 million in 2012, increased $.387 million from 2011's total of $3.656 million. The largest driver of noninterest income in 2012 was secondary market mortgage activities and gains from SBA/USDA loan sales. Income from secondary mortgage activities totaled $1.390 million in 2012 compared to $.700 million in 2011. SBA/USDA loan sale gains were $1.176 million compared to 2011 gains of $1.500 million.
Noninterest expense, at $16.757 million in 2012, increased $.788 million, or 4.93% from 2011. Increased expenses were noted in data processing, professional services associated with the divesture auction of our TARP securities and nominal employment costs. The FDIC premiums were reduced by $.390 million, or 45.94% in 2012 from $.849 million in 2011. George, commenting on areas of increased expenses, stated, "We remain diligent in our efforts to manage our operating expenses in the ongoing evaluation of our operating platform to improve efficiencies. This has become ever more challenging for all banks in our current regulatory banking climate, where the need is critical to ensure that comprehensive risk management systems and personnel infrastructure keep pace with a constantly changing banking profile, both internally and externally."
Capital
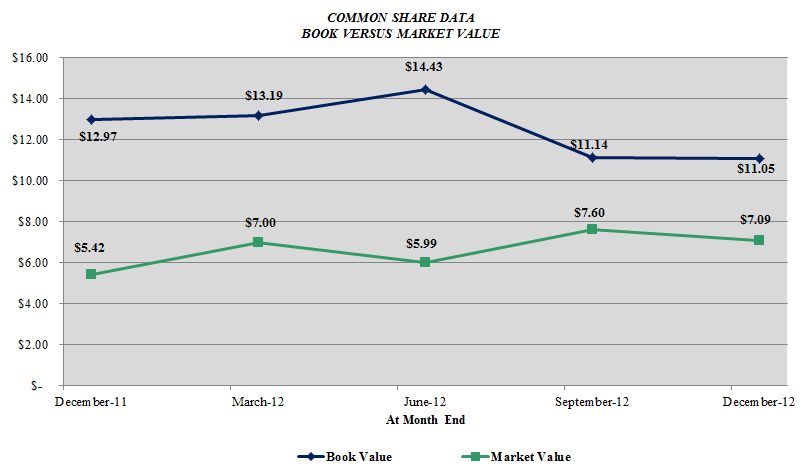
In August, the Corporation consummated the common stock rights offering and the capital investment by Steinhardt Capital Investors, LLLP with the issuance of 2.140 million shares of common stock for $11.500 million in net proceeds. Total shareholders' equity at December 31, 2012 totaled $72.448 million, compared to $55.263 million at 2011 year-end, an increase of $17.185 million, or 31.10%. Book value of common shareholders' equity was $11.05 per share at December 31, 2012 compared to $12.97 per share at December 31, 2011.
Paul D. Tobias, Chairman and Chief Executive Officer, concluded, "We are proud of our operating results for 2012. Looking forward, we are well positioned for expansion with strong credit quality and capital above the 'well capitalized' regulatory guidelines. The capital raised this year and our new relationship with the Steinhardt family are significant achievements and give us flexibility in an uncertain banking world. Regulatory costs and increasing capital requirements are creating an environment where capital is once again 'King.' To provide further flexibility, we are also in the process of setting up an $8.0 million line of credit with one of our correspondent banks.
"Our capital strength and our earnings momentum has led to the establishment of a dividend on our common stock, initially at $.04 per quarter. We are pleased to be able to reward our shareholders for their loyalty and faith. We will continue to focus on our organic growth but will also keep an eye out for external expansion opportunities that we can execute and where returns will exceed our cost of capital.
"On the list of value creation options will be the partial or full redemption of our preferred stock securities, now held by friends and investors. The current dividend at 5% without tax shelter moves to 9% without tax shelter in early 2014. We will evaluate our redemption strategy and base our timing and level of redemption on these cost factors and the quality of probable returns of alternate uses. We believe prudent growth, strong earnings, proper use of capital and returning excess capital to shareholders will help create fair market valuation for the benefit of all shareholders."
Mackinac Financial Corporation is a registered bank holding company formed under the Bank Holding Company Act of 1956 with assets of $546 million and whose common stock is traded on the NASDAQ stock market as "MFNC." The principal subsidiary of the Corporation is mBank. Headquartered in Manistique, Michigan, mBank has 11 branch locations; seven in the Upper Peninsula, three in the Northern Lower Peninsula and one in Oakland County, Michigan. The Corporation's banking services include commercial lending and treasury management products and services geared toward small to mid-sized businesses, as well as a full array of personal and business deposit products and consumer loans.
Forward-Looking Statements
This release contains certain forward-looking statements. Words such as "anticipates," "believes," "estimates," "expects," "intends," "should," "will," and variations of such words and similar expressions are intended to identify forward-looking statements: as defined by the Private Securities Litigation Reform Act of 1995. These statements reflect management's current beliefs as to expected outcomes of future events and are not guarantees of future performance. These statements involve certain risks, uncertainties and assumptions that are difficult to predict with regard to timing, extent, likelihood, and degree of occurrence. Therefore, actual results and outcomes may materially differ from what may be expressed or forecasted in such forward-looking statements. Factors that could cause a difference include among others: changes in the national and local economies or market conditions; changes in interest rates and banking regulations; the impact of competition from traditional or new sources; and the possibility that anticipated cost savings and revenue enhancements from mergers and acquisitions, bank consolidations, branch closings and other sources may not be fully realized at all or within specified time frames as well as other risks and uncertainties including but not limited to those detailed from time to time in filings of the Company with the Securities and Exchange Commission. These and other factors may cause decisions and actual results to differ materially from current expectations. Mackinac Financial Corporation undertakes no obligation to revise, update, or clarify forward-looking statements to reflect events or conditions after the date of this release.
| MACKINAC FINANCIAL CORPORATION AND SUBSIDIARIES | |||||||||
| SELECTED FINANCIAL HIGHLIGHTS | |||||||||
| December 31, | December 31, | ||||||||
| (Dollars in thousands, except per share data) | 2012 | 2011 | |||||||
| (Unaudited) | |||||||||
| Selected Financial Condition Data (at end of period): | |||||||||
| Assets | $ | 545,980 | $ | 498,311 | |||||
| Loans | 449,177 | 401,246 | |||||||
| Investment securities | 43,799 | 38,727 | |||||||
| Deposits | 434,557 | 404,789 | |||||||
| Borrowings | 35,925 | 35,997 | |||||||
| Common Shareholders' Equity | 61,448 | 44,342 | |||||||
| Shareholders' equity | 72,448 | 55,263 | |||||||
| Selected Statements of Income Data | |||||||||
| Net interest income | $ | 19,824 | $ | 17,929 | |||||
| Income before taxes and preferred dividend | 6,165 | 3,316 | |||||||
| Net income | 6,459 | 1,452 | |||||||
| Income per common share - Basic | 1.51 | .42 | |||||||
| Income per common share - Diluted | 1.46 | .41 | |||||||
| Weighted average shares outstanding | 4,285,043 | 3,419,736 | |||||||
| Weighted average shares outstanding - Diluted | 4,412,625 | 3,500,204 | |||||||
| Selected Financial Ratios and Other Data: | |||||||||
| Performance Ratios: | |||||||||
| Net interest margin | 4.17 | % | 4.06 | % | |||||
| Efficiency ratio | 67.95 | 68.43 | |||||||
| Return on average assets | 1.23 | .30 | |||||||
| Return on average common equity | 12.43 | 3.30 | |||||||
| Return on average equity | 10.26 | 2.66 | |||||||
| Average total assets | $ | 526,740 | $ | 489,539 | |||||
| Average common shareholders' equity | 51,978 | 43,940 | |||||||
| Average total shareholders' equity | 62,939 | 54,561 | |||||||
| Average loans to average deposits ratio | 99.45 | % | 98.05 | % | |||||
| Common Share Data at end of period: | |||||||||
| Market price per common share | $ | 7.09 | $ | 5.42 | |||||
| Book value per common share | $ | 11.05 | $ | 12.97 | |||||
| Common shares outstanding | 5,559,859 | 3,419,736 | |||||||
| Other Data at end of period: | |||||||||
| Allowance for loan losses | $ | 5,218 | $ | 5,251 | |||||
| Non-performing assets | $ | 8,001 | $ | 11,155 | |||||
| Allowance for loan losses to total loans | 1.16 | % | 1.31 | % | |||||
| Non-performing assets to total assets | 1.47 | % | 2.24 | % | |||||
| Texas ratio | 10.30 | % | 18.43 | % | |||||
| Number of: | |||||||||
| Branch locations | 11 | 11 | |||||||
| FTE Employees | 121 | 116 | |||||||
| MACKINAC FINANCIAL CORPORATION AND SUBSIDIARIES CONSOLIDATED BALANCE SHEETS |
|||||||||||
| December 31, | December 31, | ||||||||||
| 2012 | 2011 | ||||||||||
| (Unaudited) | |||||||||||
| ASSETS | |||||||||||
| Cash and due from banks | $ | 26,958 | $ | 20,071 | |||||||
| Federal funds sold | 3 | 13,999 | |||||||||
| Cash and cash equivalents | 26,961 | 34,070 | |||||||||
| Interest-bearing deposits in other financial institutions | 10 | 10 | |||||||||
| Securities available for sale | 43,799 | 38,727 | |||||||||
| Federal Home Loan Bank stock | 3,060 | 3,060 | |||||||||
| Loans: | |||||||||||
| Commercial | 342,841 | 311,215 | |||||||||
| Mortgage | 95,413 | 83,106 | |||||||||
| Consumer | 10,923 | 6,925 | |||||||||
| Total Loans | 449,177 | 401,246 | |||||||||
| Allowance for loan losses | (5,218 | ) | (5,251 | ) | |||||||
| Net loans | 443,959 | 395,995 | |||||||||
| Premises and equipment | 10,633 | 9,627 | |||||||||
| Other real estate held for sale | 3,212 | 3,162 | |||||||||
| Deferred Tax Asset | 9,131 | 8,427 | |||||||||
| Other assets | 5,215 | 5,233 | |||||||||
| TOTAL ASSETS | $ | 545,980 | $ | 498,311 | |||||||
| LIABILITIES AND SHAREHOLDERS' EQUITY | |||||||||||
| LIABILITIES: | |||||||||||
| Deposits: | |||||||||||
| Noninterest bearing deposits | $ | 67,652 | $ | 51,273 | |||||||
| NOW, money market, interest checking | 155,465 | 152,563 | |||||||||
| Savings | 13,829 | 14,203 | |||||||||
| CDs < $100,000 | 135,550 | 130,685 | |||||||||
| CDs > $100,000 | 24,355 | 23,229 | |||||||||
| Brokered | 37,706 | 32,836 | |||||||||
| Total deposits | 434,557 | 404,789 | |||||||||
| Borrowings | 35,925 | 35,997 | |||||||||
| Other liabilities | 3,050 | 2,262 | |||||||||
| Total liabilities | 473,532 | 443,048 | |||||||||
| SHAREHOLDERS' EQUITY: | |||||||||||
| Preferred stock - No par value: | |||||||||||
| Authorized 500,000 shares, Issued and outstanding - 11,000 shares | 11,000 | 10,921 | |||||||||
| Common stock and additional paid in capital - No par value | |||||||||||
| Authorized - 18,000,000 shares | |||||||||||
| Issued and outstanding - 5,559,914, 3,419,736 and 3,419,736 shares respectively | 53,797 | 43,525 | |||||||||
| Retained earnings | 6,727 | 492 | |||||||||
| Accumulated other comprehensive income | 924 | 325 | |||||||||
| Total shareholders' equity | 72,448 | 55,263 | |||||||||
| TOTAL LIABILITIES AND SHAREHOLDERS' EQUITY | $ | 545,980 | $ | 498,311 | |||||||
| MACKINAC FINANCIAL CORPORATION AND SUBSIDIARIES CONSOLIDATED STATEMENTS OF OPERATIONS |
||||||||||||||
| For the Years Ended December 31, | ||||||||||||||
| 2012 | 2011 | 2010 | ||||||||||||
| (Unaudited) | ||||||||||||||
| INTEREST INCOME: | ||||||||||||||
| Interest and fees on loans: | ||||||||||||||
| Taxable | $ | 23,197 | $ | 21,627 | $ | 21,091 | ||||||||
| Tax-exempt | 116 | 147 | 188 | |||||||||||
| Interest on securities: | ||||||||||||||
| Taxable | 948 | 1,162 | 1,406 | |||||||||||
| Tax-exempt | 27 | 28 | 28 | |||||||||||
| Other interest income | 139 | 108 | 127 | |||||||||||
| Total interest income | 24,427 | 23,072 | 22,840 | |||||||||||
| INTEREST EXPENSE: | ||||||||||||||
| Deposits | 3,946 | 4,530 | 5,607 | |||||||||||
| Borrowings | 657 | 613 | 848 | |||||||||||
| Total interest expense | 4,603 | 5,143 | 6,455 | |||||||||||
| Net interest income | 19,824 | 17,929 | 16,385 | |||||||||||
| Provision for loan losses | 945 | 2,300 | 6,500 | |||||||||||
| Net interest income after provision for loan losses | 18,879 | 15,629 | 9,885 | |||||||||||
| OTHER INCOME: | ||||||||||||||
| Deposit service fees | 699 | 832 | 990 | |||||||||||
| Net security gains | - | (1 | ) | 215 | ||||||||||
| Income from secondary market loans sold | 1,390 | 700 | 539 | |||||||||||
| SBA/USDA loan sale gains | 1,176 | 1,500 | 868 | |||||||||||
| Mortgage servicing income | 417 | 400 | - | |||||||||||
| Other | 361 | 225 | 183 | |||||||||||
| Total other income | 4,043 | 3,656 | 2,795 | |||||||||||
| OTHER EXPENSE: | ||||||||||||||
| Salaries and employee benefits | 8,288 | 7,275 | 6,918 | |||||||||||
| Occupancy | 1,372 | 1,376 | 1,313 | |||||||||||
| Furniture and equipment | 885 | 827 | 806 | |||||||||||
| Data processing | 991 | 761 | 740 | |||||||||||
| Professional service fees | 1,196 | 756 | 627 | |||||||||||
| Loan and deposit | 877 | 1,137 | 910 | |||||||||||
| Writedowns and losses on other real estate held for sale | 489 | 1,137 | 2,753 | |||||||||||
| FDIC insurance assessment | 459 | 849 | 957 | |||||||||||
| Telephone | 233 | 215 | 193 | |||||||||||
| Advertising | 376 | 351 | 297 | |||||||||||
| Other | 1,591 | 1,285 | 1,084 | |||||||||||
| Total other expenses | 16,757 | 15,969 | 16,598 | |||||||||||
| Income before provision for income taxes | 6,165 | 3,316 | (3,918 | ) | ||||||||||
| Provision for income taxes | (922 | ) | 1,098 | (3,500 | ) | |||||||||
| NET INCOME | 7,087 | 2,218 | (418 | ) | ||||||||||
| Preferred dividend and accretion of discount | 629 | 766 | 742 | |||||||||||
| NET INCOME AVAILABLE TO COMMON SHAREHOLDERS | $ | 6,458 | $ | 1,452 | $ | (1,160 | ) | |||||||
| INCOME PER COMMON SHARE: | ||||||||||||||
| Basic | $ | 1.51 | $ | .42 | $ | (.34 | ) | |||||||
| Diluted | $ | 1.46 | $ | .41 | $ | (.34 | ) | |||||||
| MACKINAC FINANCIAL CORPORATION AND SUBSIDIARIES LOAN PORTFOLIO AND CREDIT QUALITY |
| (Dollars in thousands) |
| Loan Portfolio Balances (at end of period): |
| December 31, | December 31, | ||||||
| 2012 | 2011 | ||||||
| (Unaudited) | (Unaudited) | ||||||
| Commercial Loans: | |||||||
| Real estate - operators of nonresidential buildings | $ | 95,151 | $ | 75,391 | |||
| Hospitality and tourism | 40,787 | 33,306 | |||||
| Real estate agents and managers | 12,672 | 10,617 | |||||
| Lessors of nonresidential buildings | 12,128 | 16,499 | |||||
| Other | 164,874 | 155,657 | |||||
| Total Commercial Loans | 325,612 | 291,470 | |||||
| 1-4 family residential real estate | 87,948 | 77,332 | |||||
| Consumer | 10,923 | 6,925 | |||||
| Construction | |||||||
| Commercial | 17,229 | 19,745 | |||||
| Consumer | 7,465 | 5,774 | |||||
| Total Loans | $ | 449,177 | $ | 401,246 | |||
| Credit Quality (at end of period): |
| December 31, | December 31, | ||||||||
| 2012 | 2011 | ||||||||
| (Unaudited) | (Unaudited) | ||||||||
| Nonperforming Assets : | |||||||||
| Nonaccrual loans | $ | 4,687 | $ | 5,490 | |||||
| Loans past due 90 days or more | - | - | |||||||
| Restructured loans | 102 | 2,503 | |||||||
| Total nonperforming loans | 4,789 | 7,993 | |||||||
| Other real estate owned | 3,212 | 3,162 | |||||||
| Total nonperforming assets | $ | 8,001 | $ | 11,155 | |||||
| Nonperforming loans as a % of loans | 1.07 | % | 1.99 | % | |||||
| Nonperforming assets as a % of assets | 1.47 | % | 2.24 | % | |||||
| Reserve for Loan Losses: | |||||||||
| At period end | $ | 5,218 | $ | 5,251 | |||||
| As a % of average loans | 1.24 | % | 1.35 | % | |||||
| As a % of nonperforming loans | 108.96 | % | 65.69 | % | |||||
| As a % of nonaccrual loans | 111.33 | % | 95.65 | % | |||||
| Texas Ratio | 10.30 | % | 18.43 | % | |||||
| Charge-off Information (year to date): | |||||||||
| Average loans | $ | 422,440 | $ | 388,115 | |||||
| Net charge-offs | $ | 977 | $ | 3,662 | |||||
| Charge-offs as a % of average loans, annualized | .23 | % | .94 | % | |||||
| MACKINAC FINANCIAL CORPORATION AND SUBSIDIARIES QUARTERLY FINANCIAL HIGHLIGHTS |
| QUARTER ENDED | |||||||||||||||||||||
| (Unaudited) | |||||||||||||||||||||
| December 31, | September 30, | June 30, | March 31, | December 31, | |||||||||||||||||
| 2012 | 2012 | 2012 | 2012 | 2011 | |||||||||||||||||
| BALANCE SHEET (Dollars in thousands) | |||||||||||||||||||||
| Total loans | $ | 449,177 | $ | 433,958 | $ | 419,453 | $ | 414,402 | $ | 401,246 | |||||||||||
| Allowance for loan losses | (5,218 | ) | (5,186 | ) | (5,083 | ) | (5,382 | ) | (5,251 | ) | |||||||||||
| Total loans, net | 443,959 | 428,772 | 414,370 | 409,020 | 395,995 | ||||||||||||||||
| Total assets | 545,980 | 551,117 | 524,366 | 506,496 | 498,311 | ||||||||||||||||
| Core deposits | 372,496 | 372,500 | 357,933 | 355,186 | 348,724 | ||||||||||||||||
| Noncore deposits (1) | 62,061 | 66,863 | 67,448 | 56,902 | 56,065 | ||||||||||||||||
| Total deposits | 434,557 | 439,363 | 425,381 | 412,088 | 404,789 | ||||||||||||||||
| Total borrowings | 35,925 | 35,925 | 35,997 | 35,997 | 35,997 | ||||||||||||||||
| Common shareholders' equity | 61,448 | 61,945 | 49,352 | 45,119 | 44,342 | ||||||||||||||||
| Total shareholders' equity | 72,448 | 72,945 | 60,352 | 56,095 | 55,263 | ||||||||||||||||
| Total shares outstanding | 5,559,859 | 5,559,859 | 3,419,736 | 3,419,736 | 3,419,736 | ||||||||||||||||
| Weighted average shares outstanding | 5,559,859 | 4,722,029 | 3,419,736 | 3,419,736 | 3,419,736 | ||||||||||||||||
| AVERAGE BALANCES (Dollars in thousands) | |||||||||||||||||||||
| Assets | $ | 545,661 | $ | 545,788 | $ | 511,681 | $ | 503,412 | $ | 487,304 | |||||||||||
| Loans | 438,168 | 424,461 | 422,887 | 404,048 | 396,197 | ||||||||||||||||
| Deposits | 433,573 | 439,327 | 452,655 | 409,250 | 390,940 | ||||||||||||||||
| Common Equity | 61,936 | 56,327 | 44,927 | 44,469 | 44,325 | ||||||||||||||||
| Equity | 72,936 | 67,327 | 55,915 | 55,418 | 55,219 | ||||||||||||||||
| INCOME STATEMENT (Dollars in thousands) | |||||||||||||||||||||
| Net interest income | $ | 5,112 | $ | 4,930 | $ | 5,019 | $ | 4,763 | $ | 4,901 | |||||||||||
| Provision for loan losses | 150 | 150 | 150 | 495 | 1,300 | ||||||||||||||||
| Net interest income after provision | 4,962 | 4,780 | 4,869 | 4,268 | 3,601 | ||||||||||||||||
| Total noninterest income | 983 | 1,149 | 1,305 | 606 | 725 | ||||||||||||||||
| Total noninterest expense | 4,349 | 4,367 | 4,207 | 3,834 | 4,221 | ||||||||||||||||
| Income before taxes | 1,596 | 1,562 | 1,967 | 1,040 | 105 | ||||||||||||||||
| Provision for income taxes | 536 | 528 | (2,335 | ) | 349 | 27 | |||||||||||||||
| Net income | 1,060 | 1,034 | 4,302 | 691 | 78 | ||||||||||||||||
| Preferred dividend expense | 138 | 137 | 161 | 193 | 192 | ||||||||||||||||
| Net income (loss) available to common shareholders | $ | 922 | $ | 897 | $ | 4,141 | $ | 498 | $ | (114 | ) | ||||||||||
| PER SHARE DATA | |||||||||||||||||||||
| Earnings | $ | .17 | $ | .19 | $ | 1.21 | $ | .15 | $ | (.03 | ) | ||||||||||
| Book value per common share | 11.05 | 11.14 | 14.43 | 13.19 | 12.97 | ||||||||||||||||
| Market value, closing price | 7.09 | 7.60 | 5.99 | 7.00 | 5.42 | ||||||||||||||||
| ASSET QUALITY RATIOS | |||||||||||||||||||||
| Nonperforming loans/total loans | 1.07 | % | 1.22 | % | 1.28 | % | 1.65 | % | 1.99 | % | |||||||||||
| Nonperforming assets/total assets | 1.47 | 1.60 | 1.70 | 2.04 | 2.24 | ||||||||||||||||
| Allowance for loan losses/total loans | 1.16 | 1.20 | 1.21 | 1.30 | 1.31 | ||||||||||||||||
| Allowance for loan losses/nonperforming loans | 108.96 | 98.03 | 94.57 | 78.49 | 65.69 | ||||||||||||||||
| Texas ratio (2) | 10.30 | 11.26 | 13.59 | 16.84 | 18.43 | ||||||||||||||||
| PROFITABILITY RATIOS | |||||||||||||||||||||
| Return on average assets | .67 | % | .65 | % | 3.21 | % | .40 | % | (.09) | % | |||||||||||
| Return on average common equity | 5.93 | 6.33 | 36.57 | 4.53 | (1.02 | ) | |||||||||||||||
| Return on average equity | 5.03 | 5.29 | 29.39 | 3.62 | (.82 | ) | |||||||||||||||
| Net interest margin | 4.11 | 4.10 | 4.30 | 4.17 | 4.38 | ||||||||||||||||
| Efficiency ratio | 70.52 | 67.29 | 63.61 | 71.01 | 69.04 | ||||||||||||||||
| Average loans/average deposits | 99.45 | 96.62 | 101.50 | 98.73 | 101.34 | ||||||||||||||||
| CAPITAL ADEQUACY RATIOS | |||||||||||||||||||||
| Tier 1 leverage ratio | 11.98 | % | 11.93 | % | 10.16 | % | 9.95 | % | 10.08 | % | |||||||||||
| Tier 1 capital to risk weighted assets | 13.81 | 14.02 | 12.87 | 11.55 | 11.62 | ||||||||||||||||
| Total capital to risk weighted assets | 14.93 | 15.15 | 14.12 | 12.80 | 12.87 | ||||||||||||||||
| Average equity/average assets | 13.37 | 12.34 | 10.93 | 11.01 | 11.33 | ||||||||||||||||
| Tangible equity/tangible assets | 13.26 | 13.36 | 11.51 | 11.01 | 11.33 | ||||||||||||||||
| (1) Noncore deposits includes Internet CDs, brokered deposits and CDs greater than $100,000 |
| (2) Texas ratio equals nonperforming assets divided by shareholders' equity plus allowance for loan losses |
Contact Information:
Contact:
Ernie Krueger
EVP/CFO
(906) 341-7158
Website: www.bankmbank.com