NORFOLK, NE--(Marketwired - Nov 14, 2013) - Supertel Hospitality, Inc. (
2013 Third Quarter Key Events
- Reported net earnings available to common shareholders of $0.30 per basic share, compared to a loss of $(1.08) per basic share for the 2012 third quarter.
- Experienced a 3.6 percent decline in revenues from continuing operations to $17.9 million and a 3.7 percent decline in same store revenue per available room (RevPAR) due primarily to disruption caused by franchise flag changes at four hotels. Excluding the four reflagged hotels, RevPAR declined 0.5 percent over the prior year's third quarter.
- Sold five non-core hotels in the third quarter with gross proceeds of $7.3 million.
- Implemented a one-for-eight reverse split of the company's common stock.
- Strengthened management with the hiring of Jeffrey Dougan as Senior Vice President and Chief Operating Officer.
- James H. Friend elected Chairman of the Board of Directors.
Third Quarter Operating and Financial Results
Third quarter 2013 revenues from continuing operations declined 3.6 percent, to $17.9 million, compared to the like period a year-ago.
Net earnings available to common shareholders for the 2013 third quarter was $0.86 million, or $0.30 per basic share, and a net loss of $(1.3) million or $(0.13) per diluted share, compared to a net loss of $(3.1) million or $(1.08) per basic and diluted share, for the same 2012 period. The improvement was due to a change in the value of derivatives and smaller impairment losses on properties in discontinued operations versus the prior year, partially offset by $1.8 million of equity offering expenses and termination and acquisition expenses. The 2013 third quarter earnings include a non-cash, $2.7 million decrease in the fair market value of derivative liabilities, as well as an impairment charge of $0.3 million on properties which are held for sale. This compares to a non-cash, $1.2 million increase in the fair market value of derivative liabilities in the 2012 third quarter, as well as an impairment charge of $2.7 million on properties which are held for sale.
Funds from operations (FFO) was $2.5 million for the 2013 third quarter, compared to $1.3 million in the like 2012 period. Adjusted funds from operations (AFFO), which is FFO adjusted to exclude gains and losses on derivative liabilities, acquisition expense and equity offering expense, in the 2013 third quarter was $1.6 million, compared to $2.6 million in the same 2012 period.
Earnings before interest, taxes, depreciation and amortization (EBITDA) for the 2013 third quarter was $4.7 million, compared to $1.6 million in the same year-ago period. Adjusted EBITDA, which is EBITDA before noncontrolling interest, net gain/loss on disposition of assets, impairment, preferred stock dividends, unrealized gain/loss on derivatives, acquisition expense and equity offering expense, declined to $4.6 million, compared to $5.9 million for the 2012 third quarter.
In the 2013 third quarter, the 57-hotel same-store continuing operations portfolio's RevPAR declined 3.7 percent to $42.25, with a 0.3 percent improvement in ADR to $62.97 offset by a 4.0 percent occupancy decline to 67.1 percent, compared to the 2012 third quarter. Excluding the four hotels reflagged in the 2013 first quarter, RevPAR declined 0.5 percent to $42.74, with a 1.3 percent improvement in ADR to $62.70, offset by a 1.7 percent decline in occupancy to 68.2 percent.
"Three factors negatively impacted operating results in the third quarter," said Jeffrey Dougan, Supertel's Senior Vice President and Chief Operating Officer. "The largest component was caused by the transition of four hotels to lower tier brands, which is somewhat similar to opening up a new hotel in terms of re-acquainting a market to the newly reflagged property, as well as the change in brand contribution with a new hotel to the brand family. Two hotels have adapted relatively well, with their RevPAR collectively down 4 percent. The other two continue to seek traction. These two hotels face the issue of their previous brand recently opening hotels in their immediate market, thus creating additional market saturation and a longer recovery phase.
"We also were impacted by the disruption caused by Federal government turmoil, both sequestration and the concerns caused by the shutdown of the government," he said. "This protracted government uncertainty impacted October operating results and likely will continue for much if not all of the fourth quarter. The final element is that many of our markets are not experiencing occupancy growth. Year to date our occupancy is down, but we are collectively outperforming our competitive market sets. We continue to work closely with our hotel operators to focus on costs/margins and to stay closely attuned to the balance between room rate and occupancy."
The South Atlantic region, which covers Florida, Georgia, Maryland, North Carolina, Virginia and West Virginia, experienced a 14.7 percent decline in RevPAR in the third quarter. The majority of the reduction was due to the transition of two reflagged hotels and a drop in occupancy in the markets surrounding Washington D.C. and Maryland, which rely heavily on government-related business.
Supertel's third quarter results versus the industry:
(Includes Supertel's 57 same store hotels.)
| Third Quarter 2013 vs Third Quarter 2012 | |||||||||
| Occupancy % | ADR ($) | RevPAR ($) | |||||||
| 2013 | 2012 | Var. | 2013 | 2012 | Var. | 2013 | 2012 | Var. | |
| Industry - Total US | 67.9% | 67.0% | 1.4% | 111.88 | 107.57 | 4.0% | 75.97 | 72.02 | 5.5% |
| Supertel - Same Store 57 hotels | 67.1% | 69.9% | -4.0% | 62.97 | 62.79 | 0.3% | 42.25 | 43.89 | -3.7% |
| Chain Scale (1) | |||||||||
| Industry - Upscale | 75.2% | 74.5% | 0.9% | 122.75 | 117.70 | 4.3% | 92.27 | 87.65 | 5.3% |
| Supertel - Upscale 1 hotel | 66.6% | 76.6% | -13.1% | 121.36 | 123.43 | -1.7% | 80.77 | 94.53 | -14.6% |
| Industry - Upper Midscale | 70.1% | 69.3% | 1.2% | 104.29 | 101.30 | 3.0% | 73.11 | 70.17 | 4.2% |
| Supertel - Upper Midscale 19 hotels | 68.9% | 71.8% | -4.0% | 74.88 | 74.35 | 0.7% | 51.60 | 53.35 | -3.3% |
| Industry - Midscale | 62.1% | 61.3% | 1.4% | 80.21 | 78.50 | 2.2% | 49.81 | 48.09 | 3.6% |
| Supertel - Midscale 3 hotels | 54.7% | 61.8% | -11.5% | 71.22 | 68.59 | 3.8% | 38.96 | 42.39 | -8.1% |
| Industry - Economy | 61.1% | 60.3% | 1.3% | 57.83 | 55.88 | 3.5% | 35.33 | 33.70 | 4.9% |
| Supertel - Economy 34 hotels | 67.1% | 69.3% | -3.2% | 54.56 | 54.30 | 0.5% | 36.58 | 37.63 | -2.8% |
| Industry Source: STR Quarterly Review | ||
| (1) | Supertel's chain scale classifications are as follows: Upscale hotel brand in the company's portfolio consist of the Hilton Garden Inn; Upper midscale hotel brands in the company's portfolio include Comfort Inns, Comfort Suites, and Clarion; Midscale brands include Quality Inn and Baymont Inn; and Economy brands include Days Inn, Super 8, Rodeway Inn, Supertel Inn and Key West Inns. | |
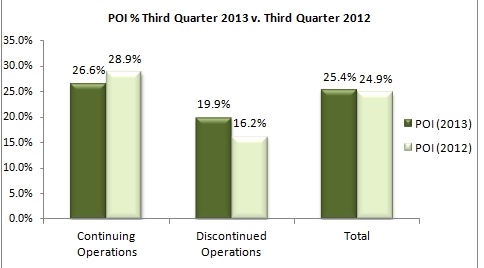
Property operating income (POI), an important operating measurement, is the revenue from room rentals and other hotel services less hotel and property operating expenses. For the 2013 third quarter, POI from continuing operations declined 11.3 percent to $4.7 million, compared to $5.4 million for the same period a year earlier.
See attached chart Property Operating Income (POI) as a percentage of revenue, Third Quarter 2013 versus Third Quarter 2012.
Disposition Program
The company sold five hotels for gross proceeds of $7.3 million in the 2013 third quarter:
- The 117-room Masters Inn in Tampa, FL sold on July 11, 2013.
- The 51-room Quality Inn in Minocqua WI sold on July 18, 2013.
- The 69-room Comfort Suites in Louisville, KY sold on August 22, 2013.
- The 63-room Sleep Inn in Louisville, KY, sold on August 22, 2013.
- The 77-room Super 8 in Jefferson City, MO sold on September 12, 2013.
Proceeds from the third quarter sales were used primarily to improve the company's balance sheet by reducing debt and lowering debt service. Supertel currently has 14 hotels listed as held-for-sale, four of which are under contract for sale.
Capital Reinvestment
The company invested $1.7 million in property improvements in the 2013 third quarter and $5.4 million in the past nine months. Third quarter improvements include room renovations at the Quality Inn in Sheboygan, WI; Sleep Inn in Omaha, NE; and Super 8 in Pittsburg, KS; exterior renovations at the Comfort Inn in Alexandria, VA; and a complete renovation at the Comfort Inn in Rocky Mount, VA.
Balance Sheet
During the 2013 third quarter, the company paid down its debt by $7.0 million from the proceeds of the sale of five non-core hotels. "We have reduced our overall debt by 11.4 percent from $132.8 million to $117.6 million in the past nine months," said Connie Scarpello, Supertel's Senior Vice President and Chief Financial Officer. "The average term is 3.3 years, with no maturities coming due until 2014."
On August 14, 2013, the company effected a one-for-eight reverse split of the company's common stock. In mid-September, the company commenced a follow-on stock offering of 16.7 million common shares, but subsequently withdrew the offering due to market conditions and pricing expectations.
"We were disappointed to have to withdraw the offering due to market conditions," said Kelly Walters, Supertel's President and Chief Executive Officer. "Restoring earnings and building shareholder value are our primary focuses. We continue to explore, with our capital partners and financial advisers, a number of options to obtain the necessary funding to successfully execute our business strategy to transition to primarily upscale and upper midscale properties. We remain confident that, properly implemented, this strategy will build long-term value for our shareholders."
Dividends
The company did not declare a dividend on common stock in the 2013 third quarter. Preferred dividends continued uninterrupted. The board of directors will continue to monitor the dividend policy on an ongoing basis.
New Board Chairman
During the quarter, James H. Friend was elected as Supertel's chairman of the board of directors. He replaces William C. Latham, who remains an active board member. "We thank Bill for his nearly four-year term as chairman and his role in developing our business plan," Walters said.
Outlook 2013 and Beyond
"We are now at the stage in our transformation where we must identify capital partners to fuel our business plan into a growth stage and continue to recycle capital from the sale of our non-core assets. Our advisors are actively engaged in pursuing business partnerships to support our long-term repositioning strategy and overall rebranding of the enterprise. It will be another pivotal year in 2014 in the remaking of Supertel," said Walters.
About Supertel Hospitality, Inc.
Supertel Hospitality, Inc. (
Forward Looking Statement
Certain matters within this press release are discussed using forward-looking language as specified in the Private Securities Litigation Reform Act of 1995, and, as such, may involve known and unknown risks, uncertainties and other factors that may cause the actual results or performance to differ from those projected in the forward-looking statement. These risks are discussed in the Company's filings with the Securities and Exchange Commission.
| SELECTED FINANCIAL DATA: | ||||||||||
| Supertel Hospitality, Inc. | ||||||||||
| Balance Sheet | ||||||||||
| As of September 30, 2013 and December 31, 2012 | ||||||||||
| As of | ||||||||||
| September 30, | December 31, | |||||||||
| 2013 | 2012 | |||||||||
| (unaudited) | ||||||||||
| ASSETS | ||||||||||
| Investments in hotel properties | $ | 216,883 | $ | 213,527 | ||||||
| Less accumulated depreciation | 74,051 | 70,027 | ||||||||
| 142,832 | 143,500 | |||||||||
| Cash and cash equivalents | 334 | 891 | ||||||||
| Accounts receivable, net of allowance for doubtful accounts of $118 and $201 | 3,123 | 2,070 | ||||||||
| Prepaid expenses and other assets | 5,091 | 5,151 | ||||||||
| Deferred financing costs, net | 2,158 | 2,644 | ||||||||
| Investment in hotel properties, held for sale, net | 28,284 | 47,591 | ||||||||
| $ | 181,822 | $ | 201,847 | |||||||
| LIABILITIES AND EQUITY | ||||||||||
| LIABILITIES | ||||||||||
| Accounts payable, accrued expenses and other liabilities | $ | 10,939 | $ | 8,778 | ||||||
| Derivative liabilities, at fair value | 11,441 | 15,935 | ||||||||
| Debt related to hotel properties held for sale | 24,414 | 39,461 | ||||||||
| Long-term debt | 93,180 | 93,360 | ||||||||
| 139,974 | 157,534 | |||||||||
| Redeemable preferred stock | ||||||||||
| 10% Series B, 800,000 shares authorized; $.01 par value, 332,500 shares outstanding, liquidation preference of $8,312 | 7,662 | 7,662 | ||||||||
| EQUITY | ||||||||||
| Shareholders' equity | ||||||||||
| Preferred stock, 40,000,000 shares authorized; | ||||||||||
| 8% Series A, 2,500,000 shares authorized, $.01 par value, 803,270 shares outstanding, liquidation preference of $8,033 | 8 |
8 |
||||||||
| 6.25% Series C, 3,000,000 shares authorized, $.01 par value, 3,000,000 shares outstanding, liquidation preference of $30,000 | 30 |
30 |
||||||||
| Common stock, $.01 par value, 200,000,000 shares authorized; 2,896,791 and 2,893,241 shares outstanding | 29 |
29 |
||||||||
| Common stock warrants | 0 | 252 | ||||||||
| Additional paid-in capital | 135,281 | 134,994 | ||||||||
| Distributions in excess of retained earnings | (101,277 | ) | (98,777 | ) | ||||||
| Total shareholders' equity | 34,071 | 36,536 | ||||||||
| Noncontrolling interest | ||||||||||
| Noncontrolling interest in consolidated partnership, redemption value $80 and $99 | 115 | 115 | ||||||||
| Total equity | 34,186 | 36,651 | ||||||||
| COMMITMENTS AND CONTINGENCIES | ||||||||||
| $ | 181,822 | $ | 201,847 | |||||||
| Supertel Hospitality, Inc. | |||||||||||||||||
| Results of Operations | |||||||||||||||||
| For the three and nine months ended September 30, 2013 and 2012, respectively | |||||||||||||||||
| (Dollars in thousands, except per share data) | |||||||||||||||||
| Three Months Ended | Nine Months Ended | ||||||||||||||||
| September 30, | September 30, | ||||||||||||||||
| 2013 | 2012 | 2013 | 2012 | ||||||||||||||
| REVENUES | |||||||||||||||||
| Room rentals and other hotel services | $ | 17,860 | $ | 18,528 | $ | 47,349 | $ | 48,543 | |||||||||
| EXPENSES | |||||||||||||||||
| Hotel and property operations | 13,113 | 13,178 | 36,660 | 35,549 | |||||||||||||
| Depreciation and amortization | 1,749 | 1,801 | 5,271 | 5,216 | |||||||||||||
| General and administrative | 946 | 943 | 2,986 | 2,957 | |||||||||||||
| Acquisition and termination expense | 679 | 15 | 728 | 178 | |||||||||||||
| Equity offering expense | 1,082 | 0 | 1,082 | 0 | |||||||||||||
| 17,569 | 15,937 | 46,727 | 43,900 | ||||||||||||||
| EARNINGS BEFORE NET LOSS ON DISPOSITIONS OF ASSETS, OTHER INCOME, INTEREST EXPENSE AND INCOME TAXES | 291 |
2,591 |
622 |
4,643 |
|||||||||||||
| Net gain (loss) on dispositions of assets | (9 | ) | 13 | (46 | ) | 7 | |||||||||||
| Other income (loss) | 2,671 | (1,138 | ) | 4,505 | (1,478 | ) | |||||||||||
| Interest expense | (1,512 | ) | (1,430 | ) | (4,531 | ) | (4,388 | ) | |||||||||
| Loss on debt extinguishment | (161 | ) | (1 | ) | (369 | ) | (51 | ) | |||||||||
| Impairment | 0 | 0 | 0 | (2,469 | ) | ||||||||||||
| EARNINGS (LOSS) FROM CONTINUING OPERATIONS BEFORE INCOME TAXES | 1,280 |
35 |
181 |
(3,736 |
) | ||||||||||||
| Income tax expense | 0 | 318 | 0 | 353 | |||||||||||||
| EARNINGS (LOSS) FROM CONTINUING OPERATIONS | 1,280 | (283 | ) | 181 | (4,089 | ) | |||||||||||
| Gain (loss) from discontinued operations, net of tax | 419 | (1,983 | ) | (169 | ) | 293 | |||||||||||
| NET EARNINGS (LOSS) | 1,699 | (2,266 | ) | 12 | (3,796 | ) | |||||||||||
| Earnings (loss) attributable to noncontrolling interest | (3 | ) | 1 | 0 | (1 | ) | |||||||||||
| NET EARNINGS (LOSS) ATTRIBUTABLE TO CONTROLLING INTERESTS | 1,696 |
(2,265 |
) | 12 |
(3,797 |
) | |||||||||||
| Preferred stock dividends | (837 | ) | (837 | ) | (2,512 | ) | (2,332 | ) | |||||||||
| NET EARNINGS (LOSS) ATTRIBUTABLE TO COMMON SHAREHOLDERS | $ | 859 |
$ | (3,102 |
) | $ | (2,500 |
) | $ | (6,129 |
) | ||||||
| NET EARNINGS (LOSS) PER COMMON SHARE - BASIC AND DILUTED | |||||||||||||||||
| EPS from continuing operations - Basic | $ | 0.15 | $ | (0.39 | ) | $ | (0.81 | ) | $ | (2.22 | ) | ||||||
| EPS from discontinued operations - Basic | $ | 0.15 | $ | (0.69 | ) | $ | (0.06 | ) | $ | 0.10 | |||||||
| EPS Basic | $ | 0.30 | $ | (1.08 | ) | $ | (0.87 | ) | $ | (2.12 | ) | ||||||
| EPS Diluted | $ | (0.13 | ) | $ | (1.08 | ) | $ | (0.87 | ) | $ | (2.12 | ) | |||||
| RECONCILIATION OF NON-GAAP FINANCIAL MEASURES | |||||||||||||||||
| (Unaudited - In thousands, except per share data) | |||||||||||||||||
| Three months | Nine months | ||||||||||||||||
| ended September 30, | ended September 30, | ||||||||||||||||
| 2013 | 2012 | 2013 | 2012 | ||||||||||||||
| RECONCILIATION OF NET EARNINGS (LOSS) TO FFO | |||||||||||||||||
| Net earnings (loss) attributable to common shareholders | $ | 859 | $ | (3,102 | ) | $ | (2,500 | ) | $ | (6,129 | ) | ||||||
| Depreciation and amortization | 1,749 | 2,256 | 5,551 | 6,652 | |||||||||||||
| Net gain on disposition of assets | (365 | ) | (564 | ) | (1,662 | ) | (5,827 | ) | |||||||||
| Impairment | 262 | 2,732 | 1,723 | 8,249 | |||||||||||||
| FFO available to common shareholders | $ | 2,505 | $ | 1,322 | $ | 3,112 | $ | 2,945 | |||||||||
| Unrealized (gain) loss on derivatives | (2,674 | ) | 1,232 | (4,494 | ) | 1,578 | |||||||||||
| Acquisition and termination expense | 679 | 15 | 728 | 178 | |||||||||||||
| Equity offering expense | 1,082 | 0 | 1,082 | 0 | |||||||||||||
| Adjusted FFO | $ | 1,592 | $ | 2,569 | $ | 428 | $ | 4,701 | |||||||||
| Weighted average number of shares outstanding for: | |||||||||||||||||
| calculation of FFO per share - basic | 2,891 | 2,885 | 2,889 | 2,885 | |||||||||||||
| calculation of FFO per share - diluted | 10,392 | 10,386 | 10,391 | 9,421 | |||||||||||||
| FFO per share - basic | $ | 0.87 | $ | 0.46 | $ | 1.08 | $ | 1.02 | |||||||||
| Adjusted FFO per share - basic | $ | 0.55 | $ | 0.89 | $ | 0.15 | $ | 1.63 | |||||||||
| FFO per share - diluted | $ | 0.29 | $ | 0.17 | $ | 0.43 | $ | 0.44 | |||||||||
| Adjusted FFO per share - diluted | $ | 0.20 | $ | 0.29 | $ | 0.18 | $ | 0.63 | |||||||||
FFO and Adjusted FFO ("AFFO") are non-GAAP financial measures. We consider FFO and AFFO to be market accepted measures of an equity REIT's operating performance, which are necessary, along with net earnings (loss), for an understanding of our operating results. FFO, as defined under the National Association of Real Estate Investment Trusts (NAREIT) standards, consists of net income computed in accordance with GAAP, excluding gains (or losses) from sales of real estate assets, plus depreciation, amortization and impairment of real estate assets. We believe our method of calculating FFO complies with the NAREIT definition. AFFO is FFO adjusted to exclude gains or losses on derivative liabilities, which are non-cash charges against income and which do not represent results from our core operations. AFFO also adds back acquisition costs and equity offering expense. FFO and AFFO do not represent amounts available for management's discretionary use because of needed capital replacement or expansion, debt service obligations, or other commitments and uncertainties. FFO and AFFO should not be considered as alternatives to net income (loss) (computed in accordance with GAAP) as an indicator of our liquidity, nor are they indicative of funds available to fund our cash needs, including our ability to pay dividends or make distributions. All REITs do not calculate FFO and AFFO in the same manner; therefore, our calculation may not be the same as the calculation of FFO and AFFO for similar REITs.
Diluted FFO per share and diluted Adjusted FFO per share are computed after adjusting the numerator and denominator of the basic computation for the effects of any dilutive potential common shares outstanding during the period. The Company's outstanding stock options and certain warrants to purchase common stock would be antidilutive and are not included in the dilution computation.
We use FFO and AFFO as performance measures to facilitate a periodic evaluation of our operating results relative to those of our peers. We consider FFO and AFFO to be useful additional measures of performance for an equity REIT because it facilitates an understanding of the operating performance of our properties without giving effect to real estate depreciation and amortization, which assume that the value of real estate assets diminishes predictably over time. Since real estate values have historically risen or fallen with market conditions, we believe that FFO and AFFO provide a meaningful indication of our performance.
| EBITDA and Adjusted EBITDA | |||||||||||||||||
| (Unaudited - In thousands) | |||||||||||||||||
| Three months | Nine months | ||||||||||||||||
| ended September 30, | ended September 30, | ||||||||||||||||
| 2013 | 2012 | 2013 | 2012 | ||||||||||||||
| RECONCILIATION OF NET EARNINGS (LOSS) TO ADJUSTED EBITDA | |||||||||||||||||
| Net earnings (loss) attributable to common shareholders | $ | 859 | $ | (3,102 | ) | $ | (2,500 | ) | $ | (6,129 | ) | ||||||
| Interest expense, including discontinued operations | 1,963 | 2,371 | 6,291 | 7,495 | |||||||||||||
| Loss on debt extinguishment | 165 | 1 | 1,056 | 104 | |||||||||||||
| Income tax expense (benefit), including discontinued operations | 0 | 83 | 0 | (225 | ) | ||||||||||||
| Depreciation and amortization, including discontinued operations | 1,749 |
2,256 |
5,551 |
6,652 |
|||||||||||||
| EBITDA | 4,736 | 1,609 | 10,398 | 7,897 | |||||||||||||
| Noncontrolling interest | 3 | (1 | ) | 0 | 1 | ||||||||||||
| Net gain on disposition of assets | (365 | ) | (564 | ) | (1,662 | ) | (5,827 | ) | |||||||||
| Impairment | 262 | 2,732 | 1,723 | 8,249 | |||||||||||||
| Preferred stock dividend | 837 | 837 | 2,512 | 2,332 | |||||||||||||
| Unrealized (gain) loss on derivatives | (2,674 | ) | 1,232 | (4,494 | ) | 1,578 | |||||||||||
| Acquisition and termination expense | 679 | 15 | 728 | 178 | |||||||||||||
| Equity offering expense | 1,082 | 0 | 1,082 | 0 | |||||||||||||
| ADJUSTED EBITDA | $ | 4,560 | $ | 5,860 | $ | 10,287 | $ | 14,408 | |||||||||
EBITDA and Adjusted EBITDA are financial measures that are not calculated in accordance with accounting principles generally accepted in the United States of America ("GAAP"). We calculate EBITDA and Adjusted EBITDA by adding back to net earnings (loss) available to common shareholders certain non-operating expenses and non-cash charges which are based on historical cost accounting and we believe may be of limited significance in evaluating current performance. We believe these adjustments can help eliminate the accounting effects of depreciation and amortization and financing decisions and facilitate comparisons of core operating profitability between periods, even though EBITDA and Adjusted EBITDA also do not represent an amount that accrues directly to common shareholders. In calculating Adjusted EBITDA, we add back noncontrolling interest, net (gain) loss on disposition of assets, impairment, preferred stock dividends, acquisition expenses, and equity offering expense which are cash charges. We also add back impairment and unrealized gain or loss on derivatives, which are non-cash charges.
EBITDA and Adjusted EBITDA do not represent cash generated from operating activities determined by GAAP and should not be considered as alternatives to net income, cash flow from operations or any other operating performance measure prescribed by GAAP. EBITDA and Adjusted EBITDA are not measures of our liquidity, nor are they indicative of funds available to fund our cash needs, including our ability to make cash distributions. Neither do the measurements reflect cash expenditures for long-term assets and other items that have been and will be incurred. EBITDA and Adjusted EBITDA may include funds that may not be available for management's discretionary use due to functional requirements to conserve funds for capital expenditures, property acquisitions, and other commitments and uncertainties. To compensate for this, management considers the impact of these excluded items to the extent they are material to operating decisions or the evaluation of our operating performance. EBITDA and Adjusted EBITDA, as presented, may not be comparable to similarly titled measures of other companies.
| Property Operating Income (POI) - Continuing and Discontinued Operations |
This presentation includes non-GAAP financial measures. The company believes that the presentation of hotel property operating income (POI) is helpful to investors, and represents a more useful description of its core operations, as it better communicates the comparability of its hotels' operating results.
| Unaudited-in thousands | Three months | Nine months | |||||||||||||||
| except statistical data: | ended September 30, | ended September 30, | |||||||||||||||
| 2013 | 2012 | 2013 | 2012 | ||||||||||||||
| Total Same Store Hotels: | |||||||||||||||||
| Revenue per available room (RevPAR): | $ | 42.25 | $ | 43.89 | $ | 36.65 | $ | 38.49 | |||||||||
| Average daily room rate (ADR): | $ | 62.97 | $ | 62.79 | $ | 59.67 | $ | 59.12 | |||||||||
| Occupancy percentage: | 67.1 | % | 69.9 | % | 61.4 | % | 65.1 | % | |||||||||
| Revenue from room rentals and other hotel services consists of: | |||||||||||||||||
| Room rental revenue | $ | 17,316 | $ | 17,985 | $ | 45,802 | $ | 47,169 | |||||||||
| Telephone revenue | 3 | 4 | 10 | 12 | |||||||||||||
| Other hotel service revenues | 541 | 539 | 1,537 | 1,362 | |||||||||||||
| Total revenue from room rentals and other hotel services | $ | 17,860 | $ | 18,528 | $ | 47,349 | $ | 48,543 | |||||||||
| Hotel and property operations expense | |||||||||||||||||
| Total hotel and property operations expense | $ | 13,113 | $ | 13,178 | $ | 36,660 | $ | 35,549 | |||||||||
| Property Operating Income ("POI") | |||||||||||||||||
| Total property operating income | $ | 4,747 | $ | 5,350 | $ | 10,689 | $ | 12,994 | |||||||||
| POI as a percentage of revenue from room rentals and other hotel services | |||||||||||||||||
| Total POI as a percentage of revenue | 26.6 | % | 28.9 | % | 22.6 | % | 26.8 | % | |||||||||
| Discontinued Operations | |||||||||||||||||
| Room rentals and other hotel services | |||||||||||||||||
| Total room rental and other hotel services | $ | 3,822 | $ | 8,378 | $ | 14,914 | $ | 25,643 | |||||||||
| Hotel and property operations expense | |||||||||||||||||
| Total hotel and property operations expense | $ | 3,060 | $ | 7,019 | $ | 12,341 | $ | 21,372 | |||||||||
| Property Operating Income ("POI") | |||||||||||||||||
| Total property operating income | $ | 762 | $ | 1,359 | $ | 2,573 | $ | 4,271 | |||||||||
| POI as a percentage of revenue from room rentals and other hotel services | |||||||||||||||||
| Total POI as a percentage of revenue | 19.9 | % | 16.2 | % | 17.3 | % | 16.7 | % | |||||||||
| (Unaudited -In thousands, except statistical data) | ||||||||||||||||
| Three months | Nine months | |||||||||||||||
| ended September 30, | ended September 30, | |||||||||||||||
| 2013 | 2012 | 2013 | 2012 | |||||||||||||
| Net earnings (loss) from continuing operations | $ | 1,280 | $ | (283 | ) | $ | 181 | $ | (4,089 | ) | ||||||
| Depreciation and amortization | 1,749 | 1,801 | 5,271 | 5,216 | ||||||||||||
| Net loss on disposition of assets | 9 | (13 | ) | 46 | (7 | ) | ||||||||||
| Other (income) expense | (2,671 | ) | 1,138 | (4,505 | ) | 1,478 | ||||||||||
| Interest expense | 1,512 | 1,430 | 4,531 | 4,388 | ||||||||||||
| Loss on debt extinguishment | 161 | 1 | 369 | 51 | ||||||||||||
| General and administrative expense | 946 | 943 | 2,986 | 2,957 | ||||||||||||
| Acquisition and termination expense | 679 | 15 | 728 | 178 | ||||||||||||
| Equity offering expense | 1,082 | 0 | 1,082 | 0 | ||||||||||||
| Income tax expense | 0 | 318 | 0 | 353 | ||||||||||||
| Impairment expense | 0 | 0 | 0 | 2,469 | ||||||||||||
| POI - continuing operations | $ | 4,747 | $ | 5,350 | $ | 10,689 | $ | 12,994 | ||||||||
| Three months | Nine months | |||||||||||||||
| ended September 30, | ended September 30, | |||||||||||||||
| 2013 | 2012 | 2013 | 2012 | |||||||||||||
| Gain (loss) from discontinued operations | $ | 419 | $ | (1,983 | ) | $ | (169 | ) | $ | 293 | ||||||
| Depreciation and amortization from discontinued operations | 0 | 455 | 280 | 1,436 | ||||||||||||
| Net gain on disposition of assets from discontinued operations | (374 | ) | (551 | ) | (1,708 | ) | (5,820 | ) | ||||||||
| Interest expense from discontinued operations | 451 | 941 | 1,760 | 3,107 | ||||||||||||
| Loss on debt extinguishment | 4 | 0 | 687 | 53 | ||||||||||||
| Impairment losses from discontinued operations | 262 | 2,732 | 1,723 | 5,780 | ||||||||||||
| Income tax benefit from discontinued operations | 0 | (235 | ) | 0 | (578 | ) | ||||||||||
| POI - discontinued operations | $ | 762 | $ | 1,359 | $ | 2,573 | $ | 4,271 | ||||||||
| Three months | Nine months | |||||||||||||||
| ended September 30, | ended September 30, | |||||||||||||||
| 2013 | 2012 | 2013 | 2012 | |||||||||||||
| POI--continuing operations | 4,747 | 5,350 | 10,689 | 12,994 | ||||||||||||
| POI--discontinued operations | 762 | 1,359 | 2,573 | 4,271 | ||||||||||||
| Total - POI | $ | 5,509 | $ | 6,709 | $ | 13,262 | $ | 17,265 | ||||||||
| Total POI as a percentage of revenues | 25.4 | % | 24.9 | % | 21.3 | % | 23.3 | % | ||||||||
The comparisons of same store operations are for 57 hotels in continuing operations as of July 1, 2012 for the three months ended September 30, 2013. Same store operations for the nine months ended September 30, 2013 include 56 hotels in continuing operations as of January 1, 2012.
| Supertel Hospitality, Inc. | ||||||||||||||||||||||
| Operating Statistics by Region | ||||||||||||||||||||||
| For three and nine months ended September 30, 2013 and 2012, respectively | ||||||||||||||||||||||
| (Unaudited - except per share data) | ||||||||||||||||||||||
| Three months ended September 30, 2013 | Three months ended September 30, 2012 | |||||||||||||||||||||
| Room | Room | |||||||||||||||||||||
| Region | Count | RevPAR | Occupancy | ADR | Count | RevPAR | Occupancy | ADR | ||||||||||||||
| Mountain | 214 | $ | 42.13 | 70.9 | % | $ | 59.45 | 214 | $ | 46.72 | 82.4 | % | $ | 56.68 | ||||||||
| West North Central | 1,352 | 39.90 | 73.4 | % | 54.35 | 1,352 | 38.72 | 71.9 | % | 53.84 | ||||||||||||
| East North Central | 923 | 50.15 | 71.8 | % | 69.87 | 923 | 46.37 | 68.7 | % | 67.46 | ||||||||||||
| Middle Atlantic | 142 | 48.22 | 76.2 | % | 63.31 | 142 | 48.58 | 77.7 | % | 62.50 | ||||||||||||
| South Atlantic | 1,171 | 42.72 | 58.6 | % | 72.93 | 1,171 | 50.06 | 69.3 | % | 72.26 | ||||||||||||
| East South Central | 429 | 40.47 | 63.5 | % | 63.70 | 429 | 45.44 | 68.2 | % | 66.60 | ||||||||||||
| West South Central | 225 | 21.16 | 51.6 | % | 41.02 | 225 | 24.09 | 52.1 | % | 46.25 | ||||||||||||
| Total Same Store | 4,456 | $ | 42.25 | 67.1 | % | $ | 62.97 | 4,456 | $ | 43.89 | 69.9 | % | $ | 62.79 | ||||||||
| Total Continuing Operations | 4,456 | $ | 42.25 | 67.1 | % | $ | 62.97 | 4,456 | $ | 43.89 | 69.9 | % | $ | 62.79 | ||||||||
| States included in the Regions | ||
| Mountain | Idaho and Montana | |
| West North Central | Iowa, Kansas, Missouri, Nebraska and South Dakota | |
| East North Central | Indiana and Wisconsin | |
| Middle Atlantic | Pennsylvania | |
| South Atlantic | Florida, Georgia, Maryland, North Carolina, Virginia and West Virginia | |
| East South Central | Kentucky and Tennessee | |
| West South Central | Arkansas and Louisiana | |
| Nine months ended September 30, 2013 |
Nine months ended September 30, 2012 |
|||||||||||||||||||||
| Room | Room | |||||||||||||||||||||
| Region | Count | RevPAR | Occupancy | ADR | Count | RevPAR | Occupancy | ADR | ||||||||||||||
| Mountain | 214 | $ | 35.21 | 65.7 | % | $ | 53.60 | 214 | $ | 37.46 | 71.4 | % | $ | 52.46 | ||||||||
| West North Central | 1,352 | 34.13 | 64.9 | % | 52.60 | 1,352 | 33.40 | 65.1 | % | 51.29 | ||||||||||||
| East North Central | 923 | 40.62 | 62.7 | % | 64.78 | 923 | 38.34 | 60.8 | % | 63.01 | ||||||||||||
| Middle Atlantic | 142 | 43.25 | 70.5 | % | 61.39 | 142 | 44.78 | 73.9 | % | 60.64 | ||||||||||||
| South Atlantic | 1,071 | 39.46 | 58.2 | % | 67.80 | 1,071 | 45.64 | 69.3 | % | 65.87 | ||||||||||||
| East South Central | 429 | 35.73 | 56.5 | % | 63.20 | 429 | 42.61 | 64.0 | % | 66.61 | ||||||||||||
| West South Central | 225 | 21.03 | 50.1 | % | 41.95 | 225 | 24.67 | 53.1 | % | 46.47 | ||||||||||||
| Total Same Store * | 4,356 | $ | 36.65 | 61.4 | % | $ | 59.67 | 4,356 | $ | 38.49 | 65.1 | % | $ | 59.12 | ||||||||
| South Atlantic Acquisitions | 100 | $ | 81.48 | 65.3 | % | $ | 124.80 | 100 | $ | 94.10 | 75.8 | % | $ | 124.16 | ||||||||
| Total Acquisitions | 100 | $ | 81.48 | 65.3 | % | $ | 124.80 | 100 | $ | 94.10 | 75.8 | % | $ | 124.16 | ||||||||
| Total Continuing Operations | 4,456 | $ | 37.65 | 61.5 | % | $ | 61.22 | 4,456 | $ | 39.08 | 65.2 | % | $ | 59.93 | ||||||||
| States included in the Regions | ||
| Mountain | Idaho and Montana | |
| West North Central | Iowa, Kansas, Missouri, Nebraska and South Dakota | |
| East North Central | Indiana and Wisconsin | |
| Middle Atlantic | Pennsylvania | |
| South Atlantic | Florida, Georgia, Maryland, North Carolina, Virginia and West Virginia | |
| East South Central | Kentucky and Tennessee | |
| West South Central | Arkansas and Louisiana | |
| Operating Statistics by Chain Scale Classification |
| For three and nine months ended September 30, 2013 and 2012, respectively |
The comparisons of same store operations are for 57 hotels in continuing operations as of July 1, 2012 for the three months ended September 30, 2013. Same store operations for the nine months ended September 30, 2013 include 56 hotels in continuing operations as of January 1, 2012.
| (Unaudited - except per share data) | |||||||||||||||||||||||||||
| Three months ended September 30, 2013 | Three months ended September 30, 2012 | Percent of Change | |||||||||||||||||||||||||
| Same Store: | RevPAR | Occupancy | ADR | RevPAR | Occupancy | ADR | RevPAR | Occupancy | ADR | ||||||||||||||||||
| Upscale | $ | 80.77 | 66.6 | % | $ | 121.36 | $ | 94.53 | 76.6 | % | $ | 123.43 | (14.6) | % | (13.1) | % | (1.7) | % | |||||||||
| Upper Midscale | 51.60 | 68.9 | % | 74.88 | 53.35 | 71.8 | % | 74.35 | (3.3) | % | (4.0) | % | 0.7 | % | |||||||||||||
| Midscale | 38.96 | 54.7 | % | 71.22 | 42.39 | 61.8 | % | 68.59 | (8.1) | % | (11.5) | % | 3.8 | % | |||||||||||||
| Economy | 36.58 | 67.1 | % | 54.56 | 37.63 | 69.3 | % | 54.30 | (2.8) | % | (3.2) | % | 0.5 | % | |||||||||||||
| Total | $ | 42.25 | 67.1 | % | $ | 62.97 | $ | 43.89 | 69.9 | % | $ | 62.79 | (3.7) | % | (4.0) | % | 0.3 | % | |||||||||
| Nine months ended September 30, 2013 | Nine months ended September 30, 2012 | Percent of Change | |||||||||||||||||||||||||
| Same Store: | RevPAR | Occupancy | ADR | RevPAR | Occupancy | ADR | RevPAR | Occupancy | ADR | ||||||||||||||||||
| Upper Midscale | $ | 45.48 | 62.9 | % | $ | 72.32 | $ | 49.04 | 68.3 | % | $ | 71.78 | (7.3) | % | (7.9) | % | 0.8 | % | |||||||||
| Midscale | 30.72 | 46.7 | % | 65.74 | 33.19 | 51.3 | % | 64.76 | (7.4) | % | (9.0) | % | 1.5 | % | |||||||||||||
| Economy | 32.78 | 61.7 | % | 53.14 | 33.74 | 64.5 | % | 52.34 | (2.8) | % | (4.3) | % | 1.5 | % | |||||||||||||
| Total | $ | 36.65 | 61.4 | % | $ | 59.67 | $ | 38.49 | 65.1 | % | $ | 59.12 | (4.8) | % | (5.7) | % | 0.9 | % | |||||||||
Contact Information:
Contact:
Ms. Krista Arkfeld
Director of Corporate Communications
karkfeld@supertelinc.com