TRUCKEE, Calif., Jan. 6, 2014 (GLOBE NEWSWIRE) -- Clear Capital®, the premium provider of data and solutions for real estate asset valuation and collateral risk assessment, today released its Home Data Index™ (HDI) Market Report with data through December 2013. Using a broad array of public and proprietary data sources, the HDI Market Report publishes the most granular home data and analysis earlier than nearly any other index provider in the industry.
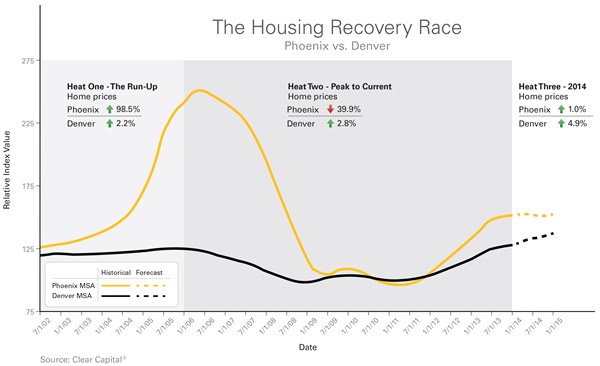
The story for home prices in 2013 is undeniably one of recovery. For ten consecutive months, yearly price gains have grown at the national level, dropping 0.9 percentage points for the first time in November since December 2012, gaining a total of 11.3% in 2013. At the metro market level, it's a different story. We observed hard-hit markets like Phoenix sprint ahead with double-digit gains, while others like Denver remained relatively steady since the run-up. It's the classic story of the tortoise (Denver) and the hare (Phoenix). While the race continues, expect to see new markets take the lead as those that have come to define the recovery taper off to their long-run historical rates of growth.
A series of sprints.
From 2002-2006, home price gains in 34 of the 50 largest major metro markets cumulatively grew on average by 77%. After the bubble burst, prices dropped on average 50.5%, peak to trough. During the run-up, these gains exceeded national gains which topped off at 46.2% and losses which nationally dropped an unprecedented 38.8% between late 2006 and 2011. We refer to what followed as the First-In, First-Out (FIFO) recovery path where the hardest hit markets saw the most pick-up in gains from the floor.
As we observe the recovery at the metro market level, these FIFO markets are the hares. They sprinted ahead, quite simply, because they had more ground to cover following the downturn. Today, these 34 "hare" markets are on average 42.4% above their troughs. Phoenix is a market that exemplifies the behavior of a hare. Prices rose a dramatic 98.5% from 2002-2006. If you bought a house in Phoenix in 2002 for $200,000, you could have nearly doubled your investment by 2006 at around $397,000. By 2011, Phoenix exceeded national losses, falling to its lowest point at 61.6% in declines from the peak. The home purchased for $200,000 in 2002 could now be worth just $152,000. In one of the strongest recoveries to-date, Phoenix prices have sprinted ahead, up 56.4%.
Phoenix's low tier homes drove both the metro's downturn and recovery. Low tier homes in Phoenix saw peak to trough declines of 70.2%, commensurate with its low tier distressed sale saturation which peaked at 77.4% in 2009. We have observed this to be the negative correlation between home price trends and distressed sale activity at play. Since late 2011, Phoenix's low tier market segment has paved the way for overall price gains, up an astonishing 93.4% from its lowest point.
If you held onto your house, weathered the volatility since 2002, you could on average be up 22.7% in hare markets. That house you bought for $200,000 in 2002 could now be worth approximately $245,000. In this first heat of the recovery from the run-up in mid-2002 to the trough in 2011, you could call the hares the winners.
It's how you tell the story.
Not all markets followed the path of the hare. The remaining 16, of the largest 50 major metro markets, managed to maintain slow and steady growth through the run-up years. On average, they cumulatively grew just 10.2%, far below the hares' average of 77% and national average of 46.2%. In the race, these are our "tortoise" markets. Peak to trough, home prices fell only 36.1% compared to the 50.5% decline for the hare markets.
While Phoenix overall is up 56.4% above its market lows, it still remains nearly 40% below peak prices. If we declare the hare the winner from the run-up in 2002, the tortoise wins the race from the peak. Average peak to current losses for the tortoise markets rest today at 24.1%, versus hare market declines of 30.4%. Again, how you tell the story matters. A 10% gain in 2002 looks much different than a 10% gain in 2012, where the price floor was much lower.
Slow and Steady.
If Phoenix behaves like a hare, Denver is the tortoise. Of the 50 major metro markets, Denver saw the lowest growth between 2002-2006 at just 2.2%. Compare that to Phoenix's 98.5%, and you may think there's no competition. But when the going got rough, Denver held steady with just 22.4% peak to trough declines. Since its lowest point in 2008, Denver home prices have risen by 28.9% and are today 2.8% above mid-2006 levels. The home you bought in Phoenix in mid-2006 for $200,000 now valued at $120,000 could be worth $206,000 had you purchased in Denver. Denver is one of the only few markets to see current prices higher than 2006 levels.
How did Denver buck the trend? Partly because it did not rise and fall like Phoenix pre- and post-run-up and saw less pressure from distressed sales, Denver prices were relatively resilient to the market meltdown experienced across the country. Specifically, the top tier, or top 75th percentile of home sales by price, declined a relatively low 10.5% peak to trough. Nationally, top tier home prices fell 28.7%. By 2009, Denver's top tier segment saw relatively low levels of REO saturation at 20% which in part helped keep the market moving forward.
The race continues. A projected winner?
Looking ahead to 2014, we see many markets moving toward the slow and steady path. As markets adjust to their recent price gains, we expect moderation to unfold. At the national level, we forecast the 11.3% growth in 2013 to give way to 3.4% growth in 2014, a sign of calibration toward long-run historical average rates of growth.
In 2014, the hares should see growth of just 2.4%, as compared to 14.6% in 2013. As the hares slow down, the tortoises are expected to catch up, tracking nearly even at 2.6% growth. Phoenix should see notable moderation, with 2014 gains expected to reach just 1%, while we predict Denver will outperform national markets with 4.9% growth in 2014.
"As we enter the next heat of a more mature recovery, there are signs the homebuyer mix may shift more toward non-investor homebuyers," said Dr. Alex Villacorta, vice president of research and analytics at Clear Capital. "Ultimately, this non-investor segment will need to get more active to truly stimulate the housing recovery in a way that will have a larger ripple effect on the broader economy. Additionally, moderation at the national level is a healthy move for the broader housing recovery as gains move back into a more sustainable, historical range. As observed over the last several years, skyrocketing gains followed by decimating declines don't benefit long-term market participants who like slow and steady gains."
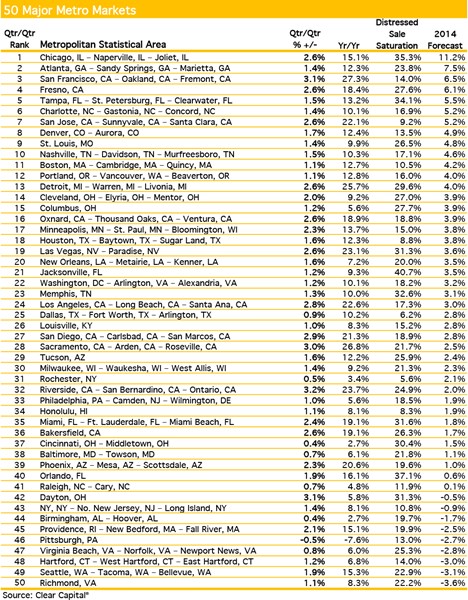
Only nine out of 50 major metro markets are expected to see minor price declines in 2014, and these declines could be avoided if the market holds up stronger than expected over the winter. At first blush, there are some surprises, like Seattle with expected declines of 3.1%. The market's median price of $300,000 could act as a barrier to entry for many investors and traditional homebuyers.
The majority of the largest major metros, 34 in total, are expected to see gains between 0% and 5%. "With just seven markets slated for price growth exceeding 5% in 2014, it may seem opportunity is scarce. There will be, however, subsets of these metro markets where gains are still plentiful," said Villacorta. "2014 is going to be a year that requires buyers looking for short- to mid-term gains to do their homework. We routinely uncover the most opportunity and risk with more granular perspective, broken out by price tiers, zip codes, even neighborhoods within zip codes. Don't be fooled or discouraged by tamer surface level trends. There will be plenty of ways the 2014 housing market could make or break your investment. If you are a buy and hold prospective homebuyer, there are three major reasons to consider pulling the trigger: great deals with prices still well below their peak, moderating home price gains leading to more stable markets and still historically relatively low interest rates."
For the complete file of the 30 Major MSA price trends for December 2013, please contact Alanna Harter or access our data on the Bloomberg Professional service by typing CLCA <GO>.
Photos accompanying this release are available at http://www.globenewswire.com/newsroom/prs/?pkgid=22870