TORONTO, ONTARIO--(Marketwired - Nov. 5, 2014) - North American Palladium Ltd. ("NAP" or the "Company") (TSX:PDL)(NYSE MKT:PAL) today announced the operating, development, and financial results for the third quarter ended September 30, 2014 ("Q3").
"Taking a view on the progress from 2013 to where we are today, we are pleased with what has been achieved during construction in 2013, commissioning and production build up in 2014 and the related financings," said Phil du Toit, President and Chief Executive Officer. "Although the third quarter presented challenges on grade due to mining sequence, equipment availability and the unfortunate incident of a mine fatality, the fourth quarter is off to a good start and we remain on track to meet our longer-term objectives."
"The exploration results so far in 2014 are very encouraging. We will keep the market apprised of progress," added Mr. du Toit.
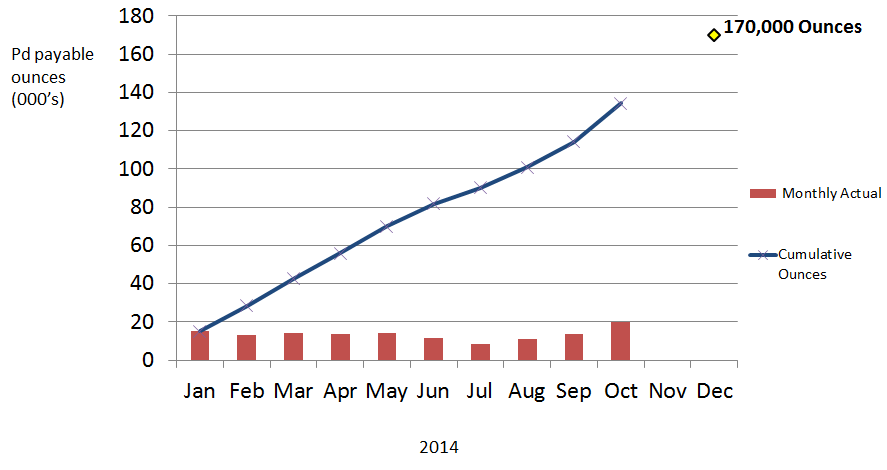
"Management continues to implement a number of strategic initiatives to help achieve the production ramp up," said Jim Gallagher, Chief Operating Officer. "On October 1, 2014 we began a trial implementation of a full-time mill run compared to our previous 16 day batch process. This initiative, plus improvements to the underground ore handling system, aided by an end of September underground ore stockpile of several days production, has resulted in October production of approximately 20,000 ounces of payable palladium."
"With these positive October results and the continuing underground ramp up which saw September and October average approximately 3,800 tonnes per day, with a number of days achieving more than 4,500 tonnes per day, we expect to be at or marginally below the lower end of our guidance of 170,000 payable palladium ounces for 2014," added Mr. Gallagher.
To view the graph titled Cumulative Pd Ounces Year to Date, please visit the following link: http://media3.marketwire.com/docs/nap.png.
Q3 2014 Results Summary
- Sold 36,430 ounces of payable palladium at a cash cost per ounce(1) of US$589. Year to date cash cost per ounce is US$527.
- Revenue of $46.4 million was an increase of $13.1 million or 39% compared to the same period in 2013 due to more favorable exchange rates, higher palladium ounces sold and higher palladium prices.
- Adjusted EBITDA(1) of $8.3 million for the quarter and $28.5 million year to date.
- Realized palladium selling price of US$860 per ounce, giving a palladium operating margin of US$271 per ounce, or US$9.9 million. Palladium prices remain strong, with the November 4, 2014 price at US$786 per ounce.
Year-To-Date Trends
The following table includes quarterly results for the first three quarters of 2014 and year to date results versus full year guidance for 2014 to help demonstrate some of the key trends in the business.
| For the three months ended | |||||||||||||
| March 31 2014 |
June 30 2014 |
September 30 2014 |
2014 Year to date |
2014 Guidance |
|||||||||
| Palladium production - payable oz | 42,641 | 39,222 | 32,560 | 114,423 | 170,000 | ||||||||
| US$ cash cost per palladium oz sold | US$492 | US$510 | US$589 | US$527 | US$550 | ||||||||
| Surface mining - tonnes | 254,294 | 243,041 | 270,860 | 768,195 | 1,000,000 | ||||||||
| Underground mining - tonnes | 275,845 | 263,904 | 304,804 | 844,553 | 1,300,000 | ||||||||
| Underground mining - tonnes per day | 3,065 | 2,900 | 3,313 | 3,094 | 3,562 | ||||||||
| Milling - palladium head grade (g/t) | 3.3 | 3.1 | 2.4 | 2.9 | 3.0 | ||||||||
| Milling - palladium recovery | 84.5 | % | 83.6 | % | 80.7 | % | 83.1 | % | 82.0 | % | |||
| Adjusted EBITDA ($000s) | $ | 9,743 | $ | 10,444 | $ | 8,287 | 28,474 | n.a. | |||||
Financial Results(2)
Revenue for the third quarter was $46.4 million compared to $33.3 million in the third quarter of 2013. The increase in revenue was primarily due to favourable exchange rate movements, higher realized prices for palladium, greater palladium ounces sold, and higher volumes of platinum, gold, nickel and copper. During the third quarter, the Company realized a palladium selling price of US$860 per ounce.
Adjusted EBITDA(1) (which excludes interest expenses and other costs, depreciation and amortization, exploration, foreign exchange gains and losses and mine restoration costs net of insurance recoveries) was $8.3 million in the third quarter of 2014, compared to $3.2 million in the third quarter of last year. For the nine months ended September 30, 2014, Adjusted EBITDA(1) was $28.5 million compared to $12.0 million in the prior year.
During the quarter, the Company incurred $23.5 million of non-cash expenses consisting of $8.0 million of foreign exchange losses, $8.6 million of depreciation, amortization and accretion and $7.0 million of interest expense and other costs. These non-cash expenses contributed to a net loss for the quarter of $18.8 million or $0.05 per share compared to a net loss of $5.3 million or $0.03 per share in the same quarter last year. The increase in the net loss is primarily due to increased foreign exchange losses, production costs and interest expense and other costs partially offset by the impact of higher revenues.
At the end of the quarter, the Company had $11.8 million in cash and availability under the credit facility of $1.2 million.
Q3 2014 Conference Call & Webcast Details
| Date: | Wednesday, November 5, 2014 |
| Time: | 8:30 a.m. ET |
| Webcast: | www.nap.com |
| Live Call: | 1-866-229-4144 or 1-416-216-4169 (PIN: 8347411, followed by # sign) |
| Replay: | 1-888-843-7419 or 1-630-652-3042 (PIN: 8347411, followed by # sign) |
The conference call replay will be available for 90 days after the live event. An archived audio webcast of the call will also be posted to NAP's website.
About North American Palladium
NAP is an established precious metals producer that has been operating its Lac des Iles mine ("LDI") located in Ontario, Canada since 1993. LDI is one of only two primary producers of palladium in the world, offering investors exposure to palladium. The Company's shares trade on the NYSE MKT under the symbol PAL and on the TSX under the symbol PDL.
(1) Non-IFRS measure. Please refer to Non-IFRS Measures in the MD&A.
(2) NAP's unaudited condensed interim consolidated financial statements for the third quarter ended September 30, 2014 are available in the Appendix of this news release. These financial statements should be read in conjunction with the notes and management's discussion and analysis available at www.nap.com, www.sedar.com and www.sec.gov.
Cautionary Statement on Forward Looking Information
Certain information contained in this news release constitutes 'forward-looking statements' within the meaning of the 'safe harbor' provisions of the United States Private Securities Litigation Reform Act of 1995 and Canadian securities laws. All statements other than statements of historical fact are forward-looking statements. The words 'will', 'expect', 'would', 'could', 'estimate' and similar expressions identify forward-looking statements. Forward-looking statements in this news release include, without limitation: information pertaining to the Company's strategy, plans or future financial or operating performance, such as the ramp-up at the Company's LDI mine, timelines, production plans, projected expenditures, operating cost estimates, proposed mining methods, expected mining rates and other statements that express management's expectations or estimates of future performance. The Company cautions the reader that such forward-looking statements involve known and unknown risk factors that may cause the actual results to be materially different from those expressed or implied by the forward-looking statements. Such risk factors include, but are not limited to: the risk that the Company may not be able to obtain sufficient financing to fund capital expenditures required to continue the LDI mine expansion at depth, the risk that the Company will not be able to meet its financial obligations as they become due, the possibility that metal prices and foreign exchange rates may fluctuate, inherent risks associated with development, exploration, mining and processing including risks to tailings capacity, ground conditions, environmental hazards, uncertainty of mineral reserves and resources, the possibility that the LDI mine may not perform as planned, changes in legislation, regulations or political and economic developments in Canada and abroad, risks related to employee relations and the availability of skilled labour, litigation, and the risks associated with obtaining necessary licenses and permits. For more details on these and other risk factors see the Company's most recent Form 40-F/Annual Information Form on file with the SEC and Canadian provincial securities regulatory authorities.
Forward-looking statements are necessarily based upon a number of factors and assumptions that, while considered reasonable by management, are inherently subject to significant business, economic and competitive uncertainties and contingencies. The factors and assumptions contained in this news release, which may prove to be incorrect, include, but are not limited to: that the Company will continue in operation for the foreseeable future and will be able to realize its assets and discharge its liabilities in the normal course of business, that metal prices and exchange rates between the Canadian and United States dollar will be consistent with the Company's expectations, that there will be no material delays affecting operations or the timing of ongoing development projects, including the LDI mine ramp-up, that prices for key mining and construction supplies, including labour costs, will remain consistent with the Company's expectations and that the Company's current estimates of mineral reserves and resources are accurate. The forward-looking statements are not guarantees of future performance. The Company disclaims any obligation to update or revise any forward-looking statements, whether as a result of new information, events or otherwise, except as expressly required by law. Readers are cautioned not to put undue reliance on these forward-looking statements.
| Condensed Interim Consolidated Balance Sheets | ||||||
| (expressed in thousands of Canadian dollars) | ||||||
| (unaudited) | ||||||
| September 30 | December 31 | |||||
| 2014 | 2013 | |||||
| ASSETS | ||||||
| Current Assets | ||||||
| Cash and cash equivalents | $ | 11,792 | $ | 9,793 | ||
| Accounts receivable | 52,536 | 38,556 | ||||
| Inventories | 14,827 | 14,239 | ||||
| Other assets | 1,094 | 6,968 | ||||
| Total Current Assets | 80,249 | 69,556 | ||||
| Non-current Assets | ||||||
| Mining interests | 446,792 | 456,239 | ||||
| Total Non-current Assets | 446,792 | 456,239 | ||||
| Total Assets | $ | 527,041 | $ | 525,795 | ||
| LIABILITIES AND SHAREHOLDERS' EQUITY | ||||||
| Current Liabilities | ||||||
| Accounts payable and accrued liabilities | $ | 18,342 | $ | 48,797 | ||
| Credit facility | 25,114 | 17,834 | ||||
| Current portion of obligations under finance leases | 3,210 | 2,988 | ||||
| Current portion of long-term debt | 7,704 | 173,656 | ||||
| Current derivative liability | 1,098 | 492 | ||||
| Total Current Liabilities | 55,468 | 243,767 | ||||
| Non-current Liabilities | ||||||
| Income taxes payable | 125 | 1,286 | ||||
| Asset retirement obligation | 15,347 | 13,638 | ||||
| Obligations under finance leases | 8,405 | 8,744 | ||||
| Long-term debt | 212,490 | 35,864 | ||||
| Total Non-current Liabilities | 236,367 | 59,532 | ||||
| Shareholders' Equity | ||||||
| Common share capital and purchase warrants | 866,108 | 798,411 | ||||
| Stock options and related surplus | 9,554 | 9,128 | ||||
| Equity component of convertible debentures, net of issue costs | 6,931 | 6,931 | ||||
| Contributed surplus | 8,873 | 8,873 | ||||
| Deficit | (656,260 | ) | (600,847 | ) | ||
| Total Shareholders' Equity | 235,206 | 222,496 | ||||
| Total Liabilities and Shareholders' Equity | $ | 527,041 | $ | 525,795 | ||
| Condensed Interim Consolidated Statements of Operations and | ||||||||||||
| Comprehensive Loss | ||||||||||||
| (expressed in thousands of Canadian dollars, except share and per share amounts) | ||||||||||||
| (unaudited) | ||||||||||||
| Three months ended September 30 |
Nine months ended September 30 |
|||||||||||
| 2014 | 2013 | 2014 | 2013 | |||||||||
| Revenue | $ | 46,441 | $ | 33,348 | $ | 145,674 | $ | 113,651 | ||||
| Mining operating expenses | ||||||||||||
| Production costs | 30,116 | 21,663 | 90,206 | 76,305 | ||||||||
| Smelting, refining and freight costs | 4,007 | 2,922 | 12,320 | 10,130 | ||||||||
| Royalty expense | 1,761 | 1,464 | 6,019 | 4,865 | ||||||||
| Depreciation and amortization | 6,894 | 6,144 | 25,436 | 19,233 | ||||||||
| Loss (gain) on disposal of equipment | 150 | (24 | ) | 1,370 | 1,030 | |||||||
| Total mining operating expenses | 42,928 | 32,169 | 135,351 | 111,563 | ||||||||
| Income from mining operations | 3,513 | 1,179 | 10,323 | 2,088 | ||||||||
| Other expenses | ||||||||||||
| Exploration | 2,566 | 3,874 | 5,225 | 10,906 | ||||||||
| General and administration | 2,120 | 2,920 | 7,285 | 8,019 | ||||||||
| Interest and other income | (1,524 | ) | (214 | ) | (3,924 | ) | (1,746 | ) | ||||
| Interest expense and other costs | 10,245 | 2,536 | 39,229 | 5,720 | ||||||||
| Financing costs | (915 | ) | 677 | 7,469 | 3,076 | |||||||
| Loss on extinguishment of long-term debt | - | - | - | 11,035 | ||||||||
| Foreign exchange loss (gain) | 9,811 | (3,290 | ) | 10,452 | 2,027 | |||||||
| Total other expenses | 22,303 | 6,503 | 65,736 | 39,037 | ||||||||
| Loss from continuing operations before taxes | (18,790 | ) | (5,324 | ) | (55,413 | ) | (36,949 | ) | ||||
| Income and mining tax recovery | - | - | - | - | ||||||||
| Loss and comprehensive loss from continuing operations for the period | $ | (18,790 | ) | $ | (5,324 | ) | $ | (55,413 | ) | $ | (36,949 | ) |
| Income and comprehensive income from discontinued operations for the period | - | - | - | 2,509 | ||||||||
| Loss and comprehensive loss for the period | $ | (18,790 | ) | $ | (5,324 | ) | $ | (55,413 | ) | $ | (34,440 | ) |
| Loss per share | ||||||||||||
| Basic | $ | (0.05 | ) | $ | (0.03 | ) | $ | (0.17 | ) | $ | (0.19 | ) |
| Diluted | $ | (0.05 | ) | $ | (0.03 | ) | $ | (0.17 | ) | $ | (0.19 | ) |
| Loss from continuing operations per share | ||||||||||||
| Basic | $ | (0.05 | ) | $ | (0.03 | ) | $ | (0.17 | ) | $ | (0.20 | ) |
| Diluted | $ | (0.05 | ) | $ | (0.03 | ) | $ | (0.17 | ) | $ | (0.20 | ) |
| Income from discontinued operations per share | ||||||||||||
| Basic | $ | - | $ | - | $ | - | $ | 0.01 | ||||
| Diluted | $ | - | $ | - | $ | - | $ | 0.01 | ||||
| Weighted average number of shares outstanding | ||||||||||||
| Basic | 384,432,246 | 194,555,425 | 322,842,483 | 183,904,755 | ||||||||
| Diluted | 384,432,246 | 194,555,425 | 322,842,483 | 183,927,098 | ||||||||
| Condensed Interim Consolidated Statements of Cash Flows | |||||||||||||
| (expressed in thousands of Canadian dollars) | |||||||||||||
| (unaudited) | |||||||||||||
| Three months ended September 30 | Nine months ended September 30 | ||||||||||||
| 2014 | 2013 | 2014 | 2013 | ||||||||||
| Cash provided by (used in) | |||||||||||||
| Operations | |||||||||||||
| Loss from continuing operations for the period | $ | (18,790 | ) | $ | (5,324 | ) | $ | (55,413 | ) | $ | (36,949 | ) | |
| Operating items not involving cash | |||||||||||||
| Depreciation and amortization | 6,894 | 6,144 | 25,436 | 19,233 | |||||||||
| Accretion expense | 1,711 | 970 | 1,272 | 2,869 | |||||||||
| Loss on extinguishment of debt | - | - | - | 11,035 | |||||||||
| Share-based compensation and employee benefits | 549 | 498 | 1,572 | 973 | |||||||||
| Unrealized foreign exchange loss (gain) | 7,953 | (1,892 | ) | 8,539 | 2,011 | ||||||||
| Loss on disposal of equipment | 150 | 2,004 | 1,370 | 3,058 | |||||||||
| Interest expense and other | 6,953 | 55 | 32,920 | 23 | |||||||||
| Financing costs | (915 | ) | - | 7,469 | - | ||||||||
| 4,505 | 2,455 | 23,165 | 2,253 | ||||||||||
| Changes in non-cash working capital | 3,519 | (433 | ) | (35,697 | ) | 85 | |||||||
| 8,024 | 2,022 | (12,532 | ) | 2,338 | |||||||||
| Financing Activities | |||||||||||||
| Issuance of common shares and warrants, net of issue costs | - | 9,478 | (38 | ) | 19,091 | ||||||||
| Issuance of convertible debentures, net of issue costs | (239 | ) | - | 61,204 | - | ||||||||
| Credit facility | (569 | ) | (7,241 | ) | 5,538 | 6,951 | |||||||
| Repayment of senior secured notes | - | - | - | (79,200 | ) | ||||||||
| Settlement of palladium warrants | - | (1,747 | ) | - | (1,747 | ) | |||||||
| Net proceeds of senior secured term loan | - | - | - | 131,941 | |||||||||
| Repayment of obligations under finance leases | (930 | ) | (595 | ) | (2,616 | ) | (2,168 | ) | |||||
| Interest paid | (32,203 | ) | (1,982 | ) | (33,768 | ) | (7,889 | ) | |||||
| Other financing costs | (779 | ) | - | (1,674 | ) | - | |||||||
| (34,720 | ) | (2,087 | ) | 28,646 | 66,979 | ||||||||
| Investing Activities | |||||||||||||
| Additions to mining interests, net | (5,817 | ) | (26,885 | ) | (14,274 | ) | (92,758 | ) | |||||
| Proceeds on disposal of mining interests, net | - | 175 | 159 | 1,165 | |||||||||
| (5,817 | ) | (26,710 | ) | (14,115 | ) | (91,593 | ) | ||||||
| Increase (decrease) in cash from continuing operations | (32,513 | ) | (26,775 | ) | 1,999 | (22,276 | ) | ||||||
| Net cash provided by discontinued operations | - | - | - | 20,142 | |||||||||
| Increase (decrease) in cash | (32,513 | ) | (26,775 | ) | 1,999 | (2,134 | ) | ||||||
| Cash and cash equivalents, beginning of period | 44,305 | 44,809 | 9,793 | 20,168 | |||||||||
| Cash and cash equivalents, end of period | $ | 11,792 | $ | 18,034 | $ | 11,792 | $ | 18,034 | |||||
| Cash and cash equivalents consisting of: | |||||||||||||
| Cash | $ | 11,792 | $ | 18,034 | $ | 11,792 | $ | 18,034 | |||||
| Short-term investments | - | - | - | - | |||||||||
| $ | 11,792 | $ | 18,034 | $ | 11,792 | $ | 18,034 | ||||||
| Foreign exchange included in cash balance | $ | 558 | $ | 211 | $ | 558 | $ | 211 | |||||
Contact Information:
John Vincic
Investor Relations
416-360-7374
jvincic@nap.com