Reykjavik, 2015-11-23 17:19 CET (GLOBE NEWSWIRE) -- Orkuveita Reykjavíkur’s (OR-Reykjavík Energy) operations were successful in the first nine months of year 2015. Rationalization in operations continue to return good and solid results despite unfavourable development in some externalities. The Plan, an operations scheme for years 2011 through 2016, has already returned the set goal. OR’s consolidated financial statements for Q3 2015 were approved by the Board of Directors today with a bottom line profit of ISK 3.1 billion.
The Plan is the key
OR’s Plan, initiated April 1st 2011 had through September 30th 2015 yielded ISK 53.2 billion in improved cash position. That is ISK 7.3 billion above target but the Plan’s ultimate goal of improving OR’s cash position by ISK 51.3 billion by year-end 2016 was already reached at mid-year 2015.
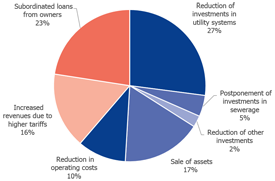
Composition of the Plan’s Yield
The attached graph depicts the share individual parts of OR’s Plan have yielded. About one-sixth of the returns can be traced to tariffs but the most important factor is decreased investment in utility systems. Permanent reduction of operating cost accounts for 10% of the Plan’s returns.
The OR Group
The largest companies comprising the OR group are Utilities, that house all licenced operations, ON Power, producing and selling electricity and hot water generated in power plants, and Reykjavik Fibre Network, which installs and operates high-end data connections. Among other things, the parent company operates a collective service centre and takes care of the group’s finances.
Bjarni Bjarnason, OR’s CEO
These financial statements depict resilience in the operation of the companies within the OR group. Reductions in operating cost endure. Improved risk management decreases sustains fluctuation in operating results, allowing us to return a profit despite low aluminium price.
Now, we consider what supersedes the Plan at year end 2016. In recent years, the Company has reached more cohesion with its stakeholders and we will do our best to maintain that.
Managers’ overview
| Operations through Q3 2015 | 2011 | 2012 | 2013 | 2014 | 2015 |
| All amounts are at each year’s price level | |||||
| Revenues | 24,388 | 27,286 | 28,806 | 26,960 | 28,768 |
| Electricity purchases and transportation | (3,610) | (3,490) | (3,902) | (3,644) | (4,645) |
| Salaries and other expenses | (5,300) | (5,958) | (5,892) | (5,551) | (5,889) |
| EBITDA | 15,478 | 17,838 | 19,012 | 17,766 | 18,234 |
| Depreciation | (6,178) | (6,862) | (6,251) | (6,510) | (7,172) |
| EBIT | 9,300 | 10,976 | 12,762 | 11,256 | 11,061 |
| Result of the period | (5,344) | 2,580 | 5,796 | 7,879 | 3,093 |
| Cash flow statement: | |||||
| Received interest income | 98 | 87 | 176 | 442 | 377 |
| Paid interest expense | (2,309) | (3,869) | (3,448) | (3,420) | (3,181) |
| Net cash from operating activities | 14,118 | 15,572 | 16,934 | 17,885 | 18,126 |
| Working capital from operation | 12,937 | 13,086 | 14,973 | 12,677 | 14,734 |
Contact:
Mr. Ingvar Stefansson
CFO
+354 617 6301