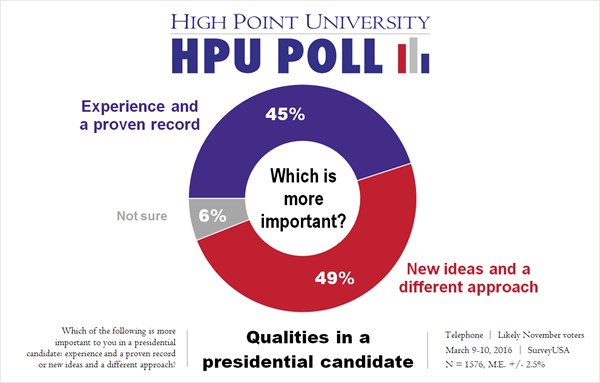
HIGH POINT, N.C., March 16, 2016 (GLOBE NEWSWIRE) -- The High Point University Poll found that North Carolina likely general election voters prefer a presidential candidate with new ideas and a different approach (49 percent) rather than a candidate with experience and proven record (45 percent).
Although the overall split was close, examining partisan preferences shows how different Democratic and Republican views of presidential qualification can be. Seventy-three percent of strong Democrats said that they prefer candidates with experience compared to 64 percent of strong Republicans who are looking for new ideas and a different approach.
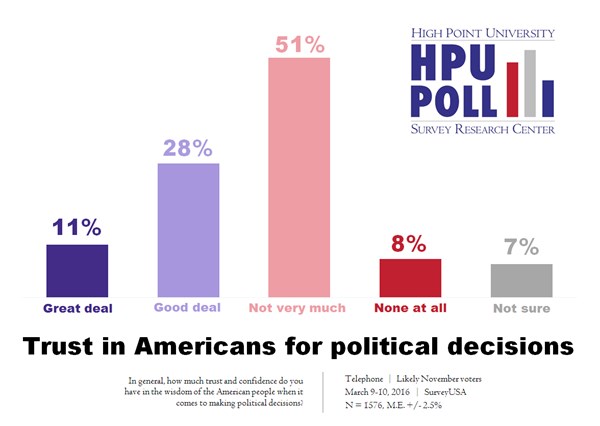
When asked about how much trust and confidence North Carolina voters have in the wisdom of the American people when it comes to making political decisions, 51 percent of the voters said not very much, while 28 percent said a good deal, 11 percent said a great deal and 8 percent said none at all.
The HPU Poll also asked how they personally felt about the federal government: content, frustrated, or angry. More of North Carolina voters (49 percent) say they are frustrated than the 36 percent who say they are angry, and the 10 percent who say that they are content with the federal government.
"Another trend we have been picking up this election cycle is that more Democrats are looking for a candidate with experience while Republicans favor candidates who represent a break from the past," says Dr. Martin Kifer, assistant professor of political science and director of the HPU Poll. "With this poll, we see the same thing, and this distinction is also related to who voters want to be their party nominees. The amount of frustration and anger directed at the government may indicate this is going to be an election focused on change."
Methodology: The High Point University Survey Research Center contracted SurveyUSA to interview 1,600 state of North Carolina registered voters March 9 and March 10, 2016, using landline respondents drawn from a Registration Based Sample (aka Voter List Sample) purchased from Aristotle in Washington, D.C. and a sample of other likely voters who responded on their smartphones, laptops, tablets, or other electronic devices. To be included in the sample, a voter who had registered prior to 2008 must have voted in the 2008 and 2012 presidential primaries as well as the 2014 general election; respondents registered between 2008 and 2012 voted in the 2012 presidential primary and 2014 general election; respondents who had registered between 2012 and 2014 voted in the 2014 primary or the 2014 general election; and the remainder of the sample registered between 2014 and 2016. Of the 1,576 likely November voters, 22 percent were determined to have already voted in person or by absentee ballot in the March 15, 2016 primary election. All likely voters also responded that they would certainly or probably vote in the Democratic or Republican primary. Other respondents were not considered likely primary voters. Respondents reachable on a home telephone (78 percent of likely November voters) were interviewed on their home telephone in the recorded voice of a professional announcer. Respondents not reachable on a home telephone (22 percent of likely November voters), were shown a questionnaire on their smartphone, laptop, tablet, or other electronic device. Data are weighted toward the voter file demographic proportions for age and gender. Details from this survey are available at http://bit.ly/1XikNdW.
Photos accompanying this release are available at:
http://www.globenewswire.com/newsroom/prs/?pkgid=39472
http://www.globenewswire.com/newsroom/prs/?pkgid=39473