TORONTO, ONTARIO--(Marketwire - July 11, 2011) - Ontario preliminary Seasonally Adjusted Annual Rate (SAAR) of home starts across urban* centres grew in June. An estimated 69,000 residential housing units got started in the latest month, up from a revised 55,600 units in May. Both single detached and multi-family home construction, which includes semi detached, townhome and apartments contributed to the increase. When compared to activity in June 2010, eleven out of fifteen major centres posted increases during the latest month. For the year ending June, new home construction in Ontario urban areas is running ten per cent above levels this time last year.
"The second quarter ended strongly pushing Ontario home starts, particularly for higher density units, above expectations," said Ted Tsiakopoulos, CMHC`s Regional Economist. "Apartment construction will remain brisk but slower job growth, more balanced resale markets and tighter mortgage markets should temper the pace of construction activity in the months ahead," added Tsiakopoulos.
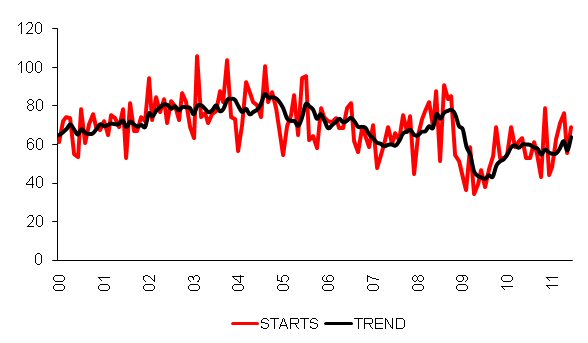
To view the Ontario Urban SAAR Starts, 000s graph, please visit the folloing link: http://media3.marketwire.com/docs/trendeng.jpg.
As Canada's national housing agency, CMHC draws on 65 years of experience to help Canadians access a variety of high quality, environmentally sustainable and affordable homes. CMHC also provides reliable, impartial and up-to-date housing market reports, analysis and knowledge to support and assist consumers and the housing industry in making informed decisions.
Aussi disponible en français
| Ontario Starts, Urban 10,000 and Over - 2011 SAAR | ||||||
| April | May | June | % Change | |||
| Total | 76,200 | 55,600 | 69,000 | 24.1% | ||
| Single | 23,600 | 20,200 | 28,200 | 39.6% | ||
| Multiple | 52,600 | 35,400 | 40,800 | 15.3% | ||
| Ontario Actual Starts, Urban 10,000+ | ||||||
| June | Year-to-Date | |||||
| 2010 | 2011 | % Change | 2010 | 2011 | % Change | |
| Total | 4,957 | 6,390 | 28.9% | 27,051 | 29,842 | 10.3% |
| Single | 2,626 | 2,943 | 12.1% | 12,571 | 10,719 | -14.7% |
| Multiple | 2,331 | 3,447 | 47.9% | 14,480 | 19,123 | 32.1% |
Starts figures in this release, other than actual starts, are seasonally adjusted annual rates (SAAR)—that is, monthly figures adjusted to remove normal seasonal variation and multiplied by 12 to reflect annual levels
* refers to provincial starts in areas with population 10,000+ (urban)
Contact Information:
Ted Tsiakopoulos
(416) 218-3407
ttsiakop@cmhc.ca
Canada:
Charles Sauriol
(613) 748-2799
csauriol@cmhc.ca