MACKINAC FINANCIAL CORPORATION AND SUBSIDIARIES
SELECTED FINANCIAL HIGHLIGHTS
(Dollars in thousands except per share September December September
data) 30, 31, 30,
2006 2005 2005
--------- --------- ---------
(Unaudited) (Unaudited)
Selected Financial Condition Data (at end
of period):
Total assets $ 363,191 $ 298,722 $ 280,590
Total loans 292,614 239,771 218,462
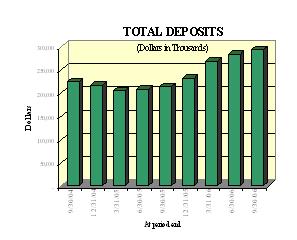
Total deposits 293,494 232,632 213,268
Borrowings 38,307 36,417 36,417
Total shareholders' equity 28,226 26,588 27,900
Selected Statements of Income Data (nine
months and year ended):
Net interest income $ 8,566 $ 9,780 $ 7,100
Income (loss) before taxes 853 (7,364) (6,336)
Net income (loss) 1,378 (7,364) (6,336)
Income (loss) per common share - Basic .40 (2.15) (1.85)
Income (loss) per common share - Diluted .40 (2.15) (1.85)
Three Months Ended
Net interest income $ 2,952 $ 2,680 $ 2,507
Income (loss) before taxes 190 (1,028) (518)
Net income (loss) 690 (1,028) (518)
Income (loss) per common share - Basic .20 (.30) (.15)
Income (loss) per common share - Diluted .20 (.30) (.15)
Selected Financial Ratios and Other Data
(nine months and year ended):
Performance Ratios:
Net interest margin 3.53% 3.64% 3.54%
Efficiency ratio 93.82 160.43 112.11
Return on average assets .54 (2.58) (.73)
Return on average equity 6.71 (25.63) (26.92)
Average total assets $ 341,646 $ 285,896 $ 280,506
Average total shareholders' equity $ 27,440 $ 28,732 $ 28,112
Average loans to average deposits ratio 98.86% 98.17% 99.33%
Common Share Data (at end of period):
Market price per common share $ 10.56 $ 9.10 $ 10.99
Book value per common share $ 8.23 $ 7.76 $ 8.14
Common shares outstanding 3,428,695 3,428,695 3,428,695
Other Data (at end of period):
Allowance for loan losses $ 5,316 $ 6,108 $ 6,589
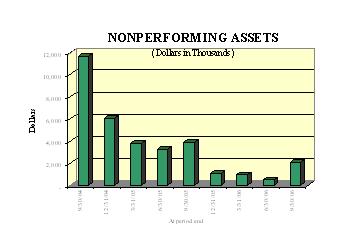
Non-performing assets $ 2,091 $ 1,059 $ 3,905
Allowance for loan losses to total loans 1.82% 2.55% 3.02%
Non-performing assets to total assets .58% .35% 1.39%
Number of:
Branch locations 13 12 12
MACKINAC FINANCIAL CORPORATION AND SUBSIDIARIES
CONSOLIDATED BALANCE SHEETS
(Dollars in thousands except per share September December September
data) 30, 31, 30,
2006 2005 2005
--------- --------- ---------
(Unaudited) (Unaudited)
ASSETS
Cash and due from banks $ 5,537 $ 4,833 $ 5,333
Federal funds sold 11,949 3,110 4,849
--------- --------- ---------
Cash and cash equivalents 17,486 7,943 10,182
Interest-bearing deposits in other
financial institutions 889 1,025 1,282
Securities available for sale 36,129 34,210 35,506
Federal Home Loan Bank stock 4,152 4,855 4,855
Total loans 292,614 239,771 218,462
Allowance for loan losses (5,316) (6,108) (6,589)
--------- --------- ---------
Net loans 287,298 233,663 211,873
Premises and equipment 12,643 11,987 11,268
Other real estate held for sale 26 945 1,948
Other assets 4,568 4,094 3,676
--------- --------- ---------
Total assets $ 363,191 $ 298,722 $ 280,590
========= ========= =========
LIABILITIES AND SHAREHOLDERS' EQUITY
Liabilities:
Non-interest-bearing deposits $ 22,826 $ 19,684 $ 19,690
Interest-bearing deposits 270,668 212,948 193,578
--------- --------- ---------
Total deposits 293,494 232,632 213,268
Borrowings 38,307 36,417 36,417
Other liabilities 3,164 3,085 3,005
--------- --------- ---------
Total liabilities 334,965 272,134 252,690
Shareholders' equity:
Preferred stock - No par value:
Authorized 500,000 shares, no shares
outstanding - - -
Common stock - No par value:
Authorized 18,000,000 shares
Issued and outstanding - 3,428,695
shares 42,646 42,412 42,412
Accumulated deficit (14,083) (15,461) (14,434)
Accumulated other comprehensive
income (337) (363) (78)
--------- --------- ---------
Total shareholders' equity 28,226 26,588 27,900
--------- --------- ---------
Total liabilities and shareholders'
equity $ 363,191 $ 298,722 $ 280,590
========= ========= =========
MACKINAC FINANCIAL CORPORATION AND SUBSIDIARIES
CONSOLIDATED STATEMENTS OF OPERATIONS
(Dollars in thousands except per
share data) Three Months Ended Nine Months Ended
-------------------- --------------------
September September September September
30, 30, 30, 30,
2006 2005 2006 2005
--------- --------- --------- ---------
(Unaudited)(Unaudited)(Unaudited)(Unaudited)
Interest income:
Interest and fees on loans:
Taxable $ 5,635 $ 3,547 $ 15,316 $ 9,807
Tax-exempt 189 222 575 694
Interest on securities:
Taxable 306 282 852 1,178
Tax-exempt 5 42 87 126
Other interest income 268 177 631 470
--------- --------- --------- ---------
Total interest income 6,403 4,270 17,461 12,275
--------- --------- --------- ---------
Interest expense:
Deposits 2,951 1,338 7,540 3,666
Borrowings 500 425 1,355 1,509
--------- --------- --------- ---------
Total interest expense 3,451 1,763 8,895 5,175
--------- --------- --------- ---------
Net interest income 2,952 2,507 8,566 7,100
Provision for loan losses - - (600) -
--------- --------- --------- ---------
Net interest income after
provision for loan losses 2,952 2,507 9,166 7,100
--------- --------- --------- ---------
Other income:
Service fees 133 137 365 470
Loan and lease fees 23 5 59 11
Net security gains (1) (1) (1) 96
Net gains on sale of loans 66 17 149 37
Other 19 96 135 194
--------- --------- --------- ---------
Total other income 240 254 707 808
--------- --------- --------- ---------
Other expenses:
Salaries, commissions, and
related benefits 1,487 1,555 4,577 4,665
Occupancy 333 275 943 748
Furniture and equipment 159 133 470 430
Data processing 176 234 512 726
Accounting, legal, and
consulting fees 341 204 955 750
Loan and deposit expense 78 153 305 696
Telephone 55 66 155 203
Advertising expense 70 314 247 696
Penalty on prepayment of FHLB
borrowings - - - 4,320
Other 303 345 856 1,010
--------- --------- --------- ---------
Total other expenses 3,002 3,279 9,020 14,244
--------- --------- --------- ---------
Income (loss) before income
taxes 190 (518) 853 (6,336)
Provision for (benefit of)
income taxes (500) - (525) -
--------- --------- --------- ---------
Net income (loss) $ 690 $ (518) $ 1,378 $ (6,336)
========= ========= ========= =========
Income (loss) per common share:
Basic $ .20 $ (.15) $ .40 $ (1.85)
========= ========= ========= =========
Diluted $ .20 $ (.15) $ .40 $ (1.85)
========= ========= ========= =========
MACKINAC FINANCIAL CORPORATION AND SUBSIDIARIES
LOAN PORTFOLIO AND CREDIT QUALITY
(Dollars in thousands)
Loan Portfolio Balances (at end of period):
September December September
30, 31, 30,
2006 2005 2005
--------- --------- ---------
Commercial Loans
Hospitality and tourism $ 37,287 $ 37,681 $ 40,424
Real estate - operators of nonresidential
buildings 35,965 28,217 24,837
Real estate agents and managers 19,744 10,588 7,837
New car dealers 10,049 9,995 5,005
Other 102,341 88,842 81,623
--------- --------- ---------
Total Commercial Loans 205,386 175,323 159,726
1-4 family residential real estate 51,341 44,660 42,490
Consumer 2,792 2,285 2,108
Construction 33,095 17,503 14,138
--------- --------- ---------
Total Loans $ 292,614 $ 239,771 $ 218,462
========= ========= =========
Credit Quality (at end of period):
September December September
30, 31, 30,
2006 2005 2005
--------- --------- ---------
Nonperforming Assets
Nonaccrual loans $ 2,065 $ 15 $ 1,957
Loans past due 90 days or more - 99 -
Restructured loans - - -
--------- --------- ---------
Total nonperforming loans 2,065 114 1,957
Other real estate owned 26 945 1,948
--------- --------- ---------
Total nonperforming assets $ 2,091 $ 1,059 $ 3,905
========= ========= =========
Nonperforming loans as a % of loans .71% 0.05% 0.90%
--------- --------- ---------
Nonperforming assets as a % of assets .58% 0.35% 1.39%
--------- --------- ---------
Reserve for Loan Losses:
At period end $ 5,316 $ 6,108 $ 6,589
--------- --------- ---------
As a % of loans 1.82% 2.55% 3.02%
--------- --------- ---------
As a % of nonperforming loans 257.43% 5,357.89% 336.69%
--------- --------- ---------
As a % of nonaccrual loans 257.43% N/M% 336.69%
========= ========= ---------
Charge-off Information:
Average loans $ 271,351 $ 207,928 $ 202,381
--------- --------- ---------
Net charge-offs $ 192 $ 858 $ 377
--------- --------- ---------
Charge-offs as a % of average loans .07% .41% .19%
--------- --------- ---------
MACKINAC FINANCIAL CORPORATION
QUARTERLY FINANCIAL SUMMARY
*(Dollars in thousands, except per share data)
Average
Average Average Average Shareholders'
Quarter Ended Assets Loans Deposits Equity
-------- -------- -------- ------------
September 30, 2006 $ 362,632 $ 289,210 $ 296,608 $ 28,041
June 30, 2006 342,820 273,686 274,591 27,213
March 31, 2006 319,007 250,735 254,720 27,055
December 31, 2005 288,619 224,386 219,967 27,288
September 30, 2005 280,506 209,785 211,197 28,112
June 30, 2005 277,754 197,545 206,875 28,879
March 31, 2005 296,856 199,703 209,035 30,692
December 31, 2004 327,543 218,962 211,685 8,455
September 30, 2004 346,078 226,951 236,418 6,096
Net Book
Return on Average Net Effi- Income Value
---------------- Interest ciency Per Per
Quarter Ended Assets Equity Margin Ratio Share Share
------- ------- ------- ------- ------- --------
September 30, 2006 .75% 9.76% 3.36% 91.17% $ 0.20 $ 7.93
June 30, 2006 .22 2.82 3.62 91.41 0.05 7.93
March 31, 2006 .63 7.47 3.62 99.37 0.15 7.93
December 31, 2005 (1.41) (14.95) 3.96 128.37 (0.30) 7.76
September 30, 2005 (0.73) (7.39) 3.79 112.11 (0.15) 8.14
June 30, 2005 (0.83) (8.01) 3.67 119.07 (0.17) 8.32
March 31, 2005 (7.16) (69.25) 3.21 300.96 (1.53) 8.42
December 31, 2004 2.95 114.17 2.48 71.83 8.25 10.13
September 30, 2004 (0.87) (49.53) 2.25 120.66 (2.17) 18.44
*Historical per share data has been adjusted for the 20:1 reverse stock
split distributed in December 2004.
Contact Information: Contact: Investor Relations (888) 343-8147 Website: www.bankmbank.com