Mackinac Financial Corporation Reports Second Quarter and Six Months 2007 Results


MANISTIQUE, MI--(Marketwire - July 24, 2007) - Mackinac Financial Corporation (NASDAQ: MFNC), the bank holding company for mBank (the "Bank"), today announced second quarter 2007 income of $.546 million, or $.16 per share, compared to net income of $.190 million, or $.05 per share, for the second quarter of 2006. Net income for the first six months of 2007 totaled $1.581 million, or $.46 per share, compared to $.688 million, or $.20 per share, for the same period in 2006. The results of operations for the first six months of 2007 include $470,000 of proceeds from the settlement of a lawsuit against the Corporation's former accountants. During the comparable six month period in 2006, the Bank recorded a $600,000 negative provision in recognition of improved credit quality. Excluding both items provides a more revealing picture of operating results. The adjusted figures show net income in the first half of 2007 of $1.111 million, compared to an adjusted net income of $.088 million for the same period in 2006.

Paul Tobias, Chairman and Chief Executive Officer, commented, "We are pleased with our earnings trends and we expect continued improvement. We are growing loans and deposits at a healthy rate and we have been able to maintain strong pricing discipline and good credit quality in our loan portfolio. Additionally, our deposit mix continues to improve. While there has been a lot of hand-wringing about the Michigan economy, we continue to see opportunities to do business with individuals and businesses that are prospering in all of our market areas. Of particular interest is our Upper Peninsula market that seems to be economically influenced by Wisconsin and Chicago area activity and is providing a steady flow of well priced loans and valuable deposits."

Total assets of the Corporation at June 30, 2007 were $393.319 million, up 11.58 percent from the $352.497 million in total assets reported at June 30, 2006. Second quarter-end total assets were up 2.75 percent from the $382.791 million of total assets at year-end 2006.

Total loans at June 30, 2007 were $338.896 million, a 19.71% increase from the $283.110 million at June 30, 2006. Total loans at the end of the second quarter of 2007 increased $16.315 million, or 5.06 percent from year-end 2006 total loans of $322.581 million. Tobias stated, "Loan growth in the first half was significantly retarded by large paydowns amounting to $23.9 million, along with normal loan principal reductions of $17.3 million; however, we are extremely satisfied with our new loan production, which totaled $64.5 million. This will translate into solid growth in the near term as these loans fund."

Total deposits of $321.246 million at June 30, 2007 were up 13.05 percent from deposits of $284.164 million on June 30, 2006. Deposits were up $8.825 million, 2.82 percent from year-end 2006 deposits of $312.421 million. Total 2007 deposit growth reflects decreases in noncore funding of $3.339 million and increases in core deposits of $12.164 million, or 7.8%. Mr. Tobias added, "The growth of core deposit balances continues to be a primary focal point in order to support loan growth with increased margin contribution. In order to enhance our deposit products, we offer internet banking and remote deposit capture for our customers. We have also expanded our branch market service areas with courier service to small and medium sized business customers. When you combine our leading edge deposit capabilities with reasonable fee structures and a great branch staff, customers notice and deposits grow. We will continue to aggressively market our deposit services."

Nonperforming assets at the end of the second quarter of 2007 totaled $5.126 million (1.30% of loans), an increase of $2.161 million from 2006 year-end balances. This 2007 increase in nonperforming assets is not indicative of significant deterioration in portfolio credit quality and is still relatively low by comparative peer standards. Tobias, commenting on credit quality, stated, "Our nonperforming assets are composed primarily of credits that we have been following since the recapitalization, and we believe that we are adequately reserved. Our credit process also includes an aggressive early resolution process for nonperforming assets, which limits our losses."

The net interest margin continues to show steady improvement, increasing from 3.36% in the third quarter of 2006 to 3.60% in the second quarter of 2007. Mr. Tobias commented, "The margin demonstrates the impact of good loan pricing and deposit growth. Our team is measured by profit improvement and the culture values fair pricing."

Shareholders' equity at June 30, 2007 totaled $30.485 million, or $8.89 per share, compared to $27.179 million, or $7.93 per share on June 30, 2006.

Tobias concluded, "We are pleased with our first half net income results. Loan balances, as mentioned, were significantly impacted by large loan paydowns. We expect that we will resume our recent loan growth trends in the second half of 2007. We are experiencing increased core deposit growth which has been aided by recent staffing additions. We are also looking at opportunities to improve noninterest income. We have been moderately successful in generating fees from the sale of mortgage loans to the secondary market and have recently expanded our efforts to generate Small Business Administration loans where the guaranteed portion can be sold into the market and generate gains. We have very recently seen some results from these efforts which will be seen in future financial statements. Our continued discipline in expense control and the expansion of noninterest income will translate into increased profitability as we advance toward and then beyond peer levels. We thank you for your support and your patience and we believe that our earnings progress will translate into meaningful shareholder value."

Mackinac Financial Corporation is a registered bank holding company which owns mBank. The Bank has 13 offices: nine in the Upper Peninsula, three in the Northern Lower Peninsula and one in Oakland County, Michigan. The Company's banking services include commercial lending and treasury management products and services geared toward small to mid-sized businesses; as well as checking and savings accounts, time deposits, interest bearing transaction accounts, safe deposit facilities, real estate mortgage lending, and direct and indirect consumer financing.

Forward-Looking Statements

This release contains certain forward-looking statements. Words such as "anticipates," "believes," "estimates," "expects," "intends," "should," "will," and variations of such words and similar expressions are intended to identify forward-looking statements: as defined by the Private Securities Litigation Reform Act of 1995. These statements reflect management's current beliefs as to expected outcomes of future events and are not guarantees of future performance. These statements involve certain risks, uncertainties and assumptions that are difficult to predict with regard to timing, extent, likelihood and degree of occurrence. Therefore, actual results and outcomes may materially differ from what may be expressed or forecasted in such forward-looking statements. Factors that could cause a difference include among others: changes in the national and local economies or market conditions; changes in interest rates and banking regulations; the impact of competition from traditional or new sources; and the possibility that anticipated cost savings and revenue enhancements from mergers and acquisitions, bank consolidations, branch closings and other sources may not be fully realized at all or within specified time frames as well as other risks and uncertainties including but not limited to those detailed from time to time in filings of the Company with the Securities and Exchange Commission. These and other factors may cause decisions and actual results to differ materially from current expectations. Mackinac Financial Corporation undertakes no obligation to revise, update, or clarify forward-looking statements to reflect events or conditions after the date of this release.

              MACKINAC FINANCIAL CORPORATION AND SUBSIDIARIES
                      SELECTED FINANCIAL HIGHLIGHTS


(Dollars in thousands, except per            For The Period Ended
 share data)                         -------------------------------------
                                       June 30,   December 31,   June 30,
                                         2007         2006         2006
                                     -----------  -----------  -----------
                                     (Unaudited)               (Unaudited)
Selected Financial Condition Data
 (at end of period):
Total assets                         $   393,319  $   382,791  $   352,497
Total loans                              338,896      322,581      283,110
Total deposits                           321,246      312,421      284,164
Borrowings and subordinated
 debentures                               38,307       38,307       37,617
Total shareholders' equity                30,485       28,790       27,179

Selected Statements of Income Data
 (six months and year ended):
Net interest income                  $     6,447  $    11,593  $     5,614
Income before taxes                        1,581        1,216          688
Net income                                 1,581        1,716          688
Income per common share - Basic              .46          .50          .20
Income per common share - Diluted            .46          .50          .20

Three Months Ended:
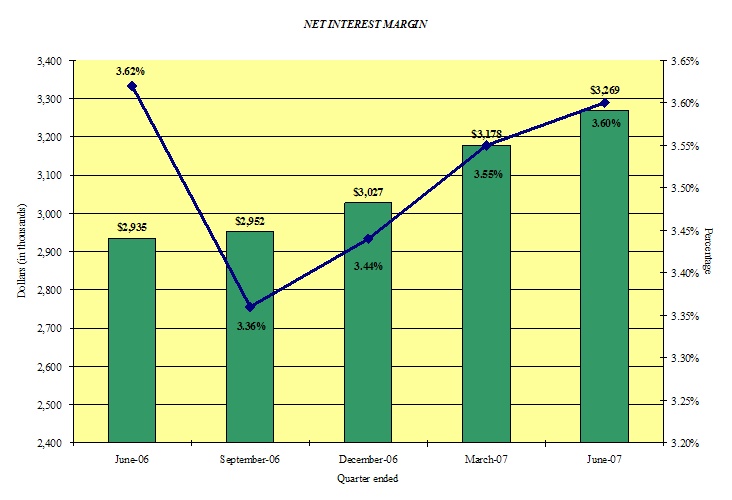
Net interest income                  $     3,269  $     3,027  $     2,935
Income before taxes                          546          338          190
Net income                                   546          338          190
Income per common share - Basic              .16          .10          .05
Income per common share - Diluted            .16          .10          .05

Selected Financial Ratios and Other
 Data (six months and year ended):
Performance Ratios:
Net interest margin                         3.57%        3.51%        3.62%
Efficiency ratio                           82.79        93.95        95.20
Return on average assets                     .84          .49          .42
Return on average equity                   10.68         6.19         5.11

Average total assets                 $   381,238  $   347,927  $   330,980
Average total shareholders' equity   $    29,836  $    27,744  $    27,135
Average loans to average deposits
 ratio                                    103.84%       99.77%       99.64%

Common Share Data (at end of
 period):
Market price per common share        $      9.45  $     11.50  $     10.27
Book value per common share          $      8.89  $      8.40  $      7.93
Common shares outstanding              3,428,695    3,428,695    3,428,695
Weighted average shares outstanding    3,428,695    3,428,695    3,428,695

Other Data (at end of period):
Allowance for loan losses            $     4,920  $     5,006  $     5,415
Non-performing assets                $     5,126  $     2,965  $       498
Allowance for loan losses to total
 loans                                      1.45%        1.55%        1.91%
Non-performing assets to total
 assets                                     1.30%         .77%         .14%
Number of:
   Branch locations                           13           13           13
   FTE Employees                             106           99           99


             ­MACKINAC FINANCIAL CORPORATION AND SUBSIDIARIES
                        CONSOLIDATED BALANCE SHEETS


                                       June 30,   December 31,   June 30,
(Dollars in thousands)                   2007         2006         2006
                                     -----------  -----------  -----------
                                     (unaudited)               (unaudited)
ASSETS

Cash and due from banks              $     7,518  $     4,865  $     5,529
Federal funds sold                         3,489        5,841       12,535
                                     -----------  -----------  -----------
   Cash and cash equivalents              11,007       10,706       18,064

Interest-bearing deposits in other
 financial institutions                    3,687          856          893
Securities available for sale             24,086       32,769       33,870
Federal Home Loan Bank stock               3,794        3,794        4,855

Loans:
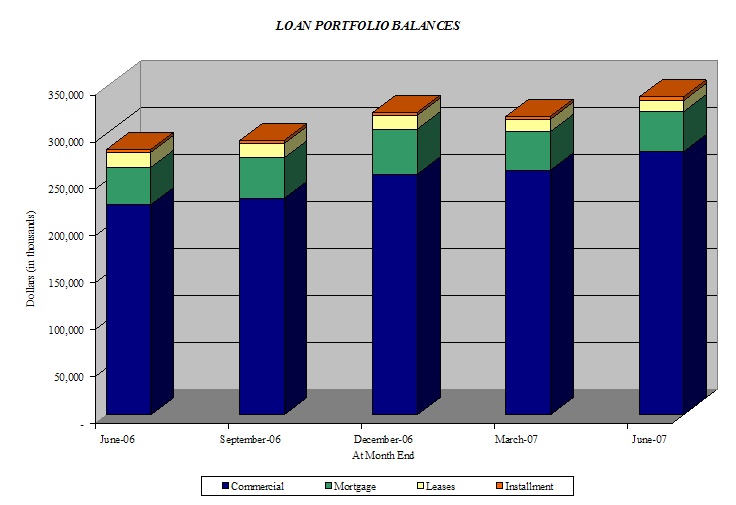
   Commercial                            292,285      261,726      231,547
   Mortgage                               42,677       58,014       48,931
   Installment                             3,934        2,841        2,632
                                     -----------  -----------  -----------
     Total Loans                         338,896      322,581      283,110
       Allowance for loan losses          (4,920)      (5,006)      (5,415)
                                     -----------  -----------  -----------
   Net loans                             333,976      317,575      277,695

Premises and equipment                    12,471       12,453       12,748
Other real estate held for sale               77           26           52
Other assets                               4,221        4,612        4,320
                                     -----------  -----------  -----------

TOTAL ASSETS                         $   393,319  $   382,791  $   352,497
                                     ===========  ===========  ===========

LIABILITIES AND SHAREHOLDERS' EQUITY
Liabilities:
   Non-interest-bearing deposits     $    28,811  $    23,471  $    21,773
   Interest-bearing deposits
     NOW and Money Market                 73,994       73,188       68,107
     Savings                              12,422       13,365       14,136
     CDs < $100,000                       96,546       89,585       81,768
     CDs > $100,000                       24,879       23,645       19,025
     Brokered                             84,594       89,167       79,355
                                     -----------  -----------  -----------
       Total deposits                    321,246      312,421      284,164

   Borrowings                             38,307       38,307       37,617
   Other liabilities                       3,281        3,273        3,537
                                     -----------  -----------  -----------
     Total liabilities                   362,834      354,001      325,318

Shareholders' equity:
   Preferred stock - No par value:
     Authorized 500,000 shares, no
      shares outstanding
   Common stock and additional paid
    in capital - No par value
     Authorized - 18,000,000 shares
     Issued and outstanding -
      3,428,695 shares                    42,780       42,722       42,567
     Accumulated deficit                 (12,162)     (13,745)     (14,772)
     Accumulated other comprehensive
      (loss)                                (133)        (187)        (616)
                                     -----------  -----------  -----------

       Total shareholders' equity         30,485       28,790       27,179
                                     -----------  -----------  -----------

TOTAL LIABILITIES AND SHAREHOLDERS'
 EQUITY                              $   393,319  $   382,791  $   352,497
                                     ===========  ===========  ===========


              MACKINAC FINANCIAL CORPORATION AND SUBSIDIARIES
                  CONSOLIDATED STATEMENTS OF OPERATIONS


(Dollars in thousands except per    Three Months Ended   Six Months Ended
 share data)                              June 30,            June 30,
                                    --------- --------- --------- --------
                                      2007      2006      2007      2006
                                    --------- --------- --------- --------
                                        (Unaudited)         (Unaudited)
INTEREST INCOME:
     Interest and fees on loans:
          Taxable                   $   6,448 $   5,182 $  12,681 $  9,681
          Tax-exempt                      143       192       314      385
     Interest on securities:
          Taxable                         293       274       594      547
          Tax-exempt                        -        41         -       82
     Other interest income                166       194       366      363
                                    --------- --------- --------- --------
          Total interest income         7,050     5,883    13,955   11,058
                                    --------- --------- --------- --------

INTEREST EXPENSE:
     Deposits                           3,267     2,509     6,489    4,589
     Borrowings                           514       439     1,019      855
                                    --------- --------- --------- --------
          Total interest expense        3,781     2,948     7,508    5,444
                                    --------- --------- --------- --------

Net interest income                     3,269     2,935     6,447    5,614
Provision for loan losses                   -         -         -     (600)
                                    --------- --------- --------- --------
Net interest income after provision
 for loan losses                        3,269     2,935     6,447    6,214
                                    --------- --------- --------- --------

OTHER INCOME:
     Service fees                         185       122       346      232
     Net security gains                     -         -         -        -
     Net gains on sale of secondary
      market loans                         91        42       199       83
     Other                                 66        87       710      152
                                    --------- --------- --------- --------
          Total other income              342       251     1,255      467
                                    --------- --------- --------- --------

OTHER EXPENSES:
     Salaries and employee benefits     1,672     1,496     3,410    3,090
     Occupancy                            327       293       661      610
     Furniture and equipment              166       155       323      311
     Data processing                      210       182       381      336
     Professional service fees            174       414       325      614
     Loan and deposit                      79        98       151      228
     Telephone                             59        51       117      100
     Advertising                           91       107       183      177
     Other                                287       200       570      527
                                    --------- --------- --------- --------
          Total other expenses          3,065     2,996     6,121    5,993
                                    --------- --------- --------- --------

Income before provision for income
 taxes                                    546       190     1,581      688
Provision for (benefit of) income
 taxes                                      -         -         -        -
                                    --------- --------- --------- --------

NET INCOME                          $     546 $     190 $   1,581 $    688
                                    ========= ========= ========= ========
INCOME PER COMMON SHARE:
     Basic                          $     .16 $     .05 $     .46 $    .20
                                    ========= ========= ========= ========
     Diluted                        $     .16 $     .05 $     .46 $    .20
                                    ========= ========= ========= ========


                 MACKINAC FINANCIAL CORPORATION AND SUBSIDIARIES
                       LOAN PORTFOLIO AND CREDIT QUALITY


(Dollars in thousands)

Loan Portfolio Balances (at end of period):

                                      June 30,   December 31,   June 30,
                                        2007         2006         2006
                                    ------------ ------------ ------------
Commercial Loans
Real estate - operators of
 nonresidential buildings           $     41,662 $     44,308 $     35,478
Hospitality and tourism                   37,286       30,826       37,754
Real estate agents and managers           31,937       25,071       15,628
New car dealers                           10,270       10,086       10,002
Other                                    117,058      115,426      101,637
                                    ------------ ------------ ------------
   Total Commercial Loans                238,213      225,717      200,499

1-4 family residential real estate        55,090       58,014       48,931
Consumer                                   3,538        2,841        2,632
Construction                              42,055       36,009       31,048
                                    ------------ ------------ ------------

   Total Loans                      $    338,896 $    322,581 $    283,110
                                    ============ ============ ============

Average loans for the period        $    321,414 $    278,953 $    262,274
                                    ============ ============ ============


Credit Quality (at end of period):


                            June 30,    December 31,   June 30,
                              2007         2006          2006
                            ----------   ----------   ----------
Nonperforming Assets :
Nonaccrual loans            $    4,758   $    2,899   $      446
Loans past due 90 days or
 more                              291           40            -
Restructured loans                   -            -            -
                            ----------   ----------   ----------
   Total nonperforming
    loans                        5,049        2,939          446
Other real estate owned             77           26           52
                            ----------   ----------   ----------
   Total nonperforming
    assets                  $    5,126   $    2,965   $      498
                            ==========   ==========   ==========
Nonperforming loans as a %
 of loans                         1.49%         .91%         .16%
                            ----------   ----------   ----------
Nonperforming assets as a %
 of assets                        1.30%         .77%         .14%
                            ----------   ----------   ----------
Reserve for Loan Losses:
At period end               $    4,920   $    5,006   $    5,415
                            ----------   ----------   ----------
As a % of average loans           1.53%        1.79%        2.06%
                            ----------   ----------   ----------
As a % of nonperforming
 loans                           97.45%      170.33%         N/M%
                            ----------   ----------   ----------
As a % of nonaccrual loans      103.41%      172.68%         N/M%
                            ==========   ==========   ==========


                 MACKINAC FINANCIAL CORPORATION AND SUBSIDIARIES
                        QUARTERLY FINANCIAL HIGHLIGHTS


                                         QUARTER ENDED
                     -----------------------------------------------------
                                           December   September
                     June 30,   March 31,     31,        30,     June 30,
                       2007       2007       2006       2006       2006
                     ---------  ---------  ---------  ---------  ---------
BALANCE SHEET
 (Dollars in
 thousands)

Total loans          $ 338,896  $ 318,421  $ 322,581  $ 292,614  $ 283,110
Allowance for loan
 losses                 (4,920)    (4,975)    (5,006)    (5,316)    (5,415)
                     ---------  ---------  ---------  ---------  ---------
   Total loans, net    333,976    313,446    317,575    287,298    277,695
Intangible assets          163        182        205        237        268
Total assets           393,319    375,644    382,791    363,191    352,497
Core deposits          211,773    201,529    199,609    195,774    185,784
Noncore deposits (1)   109,473    102,883    112,812     97,720     98,380
                     ---------  ---------  ---------  ---------  ---------
   Total deposits      321,246    304,412    312,421    293,494    284,164
Total borrowings        38,307     38,307     38,307     38,307     37,617
Total shareholders'
 equity                 30,485     29,932     28,790     28,226     27,179
Total shares
 outstanding         3,428,695  3,428,695  3,428,695  3,428,695  3,428,695

AVERAGE BALANCES
 (Dollars in
 thousands)

Assets               $ 382,065  $ 380,403  $ 347,927  $ 362,632  $ 342,820
Loans                  324,721    318,072    301,508    289,210    273,686
Deposits               309,469    309,619    294,755    296,608    274,591
Equity                  30,412     29,254     27,744     28,041     27,213

INCOME STATEMENT
 (Dollars in
 thousands)

Net interest income  $   3,269  $   3,178  $   3,027  $   2,952  $   2,935
Provision for loan
 losses                      -          -       (261)         -          -
                     ---------  ---------  ---------  ---------  ---------
   Net interest
    income after
    provision            3,269      3,178      3,288      2,952      2,935
Total noninterest
 income                    342        913        276        240        251
Total noninterest
 expense                 3,065      3,056      3,226      3,002      2,996
                     ---------  ---------  ---------  ---------  ---------
Income before taxes        546      1,035        338        190        190
Provision for income
 taxes                       -          -          -       (500)         -
                     ---------  ---------  ---------  ---------  ---------
Net income           $     546  $   1,035  $     338  $     690  $     190
                     =========  =========  =========  =========  =========

PER SHARE DATA

Earnings - basic     $     .46  $     .30  $     .10  $     .20  $     .05
Earnings - diluted         .46        .30        .10        .20        .05
Book value                8.89       8.73       8.40       8.23       7.93
Market value,
 closing price            9.45       9.26      11.50      10.56      10.27

ASSET QUALITY RATIOS

Nonperforming
 loans/total loans        1.49%      1.53%       .91%       .71%       .16
Nonperforming
 assets/total assets      1.30       1.33        .77        .58        .14
Allowance for loan
 losses/total loans       1.45       1.56       1.55       1.82       1.91
Allowance for loan
 losses/nonperforming
 loans                   97.45     102.32     170.33     257.43   1,214.13

PROFITABILITY RATIOS

Return on average
 assets                    .57%      1.10%       .37%       .75%       .22
Return on average
 equity                   7.20      14.35       4.68       9.76       2.82
Net interest margin       3.60       3.55       3.44       3.36       3.62
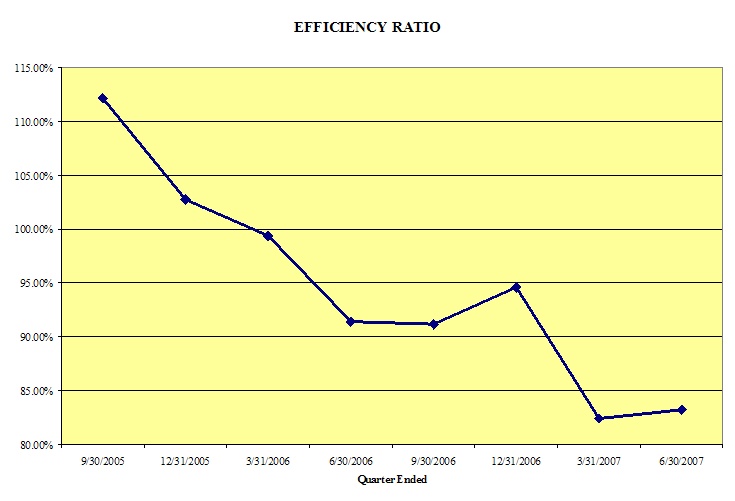
Efficiency ratio         83.21      82.40      94.60      91.17      91.41
Averageloans/average
 deposits               104.93     102.73     102.29      97.51      99.67

CAPITAL ADEQUACY
 RATIOS

Leverage ratio            7.97%      7.85%      7.85%      7.81%      8.04
Tier 1 capital ratio      8.85       9.16       8.77       9.36       9.28
Total capital ratio      10.10      10.41      10.02      10.62      10.54
Averageequity/average
 assets                   7.96       7.69       7.81       7.73       7.94
Tangible equity/tangible
 assets                   7.71       7.92       7.47       7.71       7.64

(1)  Noncore deposits includes Internet CDs, brokered deposits and CDs
greater than $100,000

Contact Information: Contact: Investor Relations (888) 343-8147 Website: www.bankmbank.com