MACKINAC FINANCIAL CORPORATION AND SUBSIDIARIES
SELECTED FINANCIAL HIGHLIGHTS
(Dollars in thousands, except per
share data) For The Period Ended
-------------------------------------
September 30, December 31, September 30,
2008 2007 2007
----------- ----------- -----------
(unaudited) (unaudited)
Selected Financial Condition Data
(at end of period):
Total assets $ 440,953 $ 408,880 $ 401,213
Total loans 361,521 355,079 344,149
Total deposits 360,694 320,827 321,371
Borrowings and subordinated
debentures 36,210 45,949 38,239
Total shareholders' equity 41,427 39,321 38,697
Selected Statements of Income Data
(nine months and year ended):
Net interest income $ 9,534 $ 13,417 $ 10,007
Income before taxes 3,082 2,923 2,136
Net income 2,124 10,163 9,636
Income per common share - Basic .62 2.96 2.81
Income per common share - Diluted .62 2.96 2.81
Weighted average shares outstanding 3,422,777 3,428,695 3,428,695
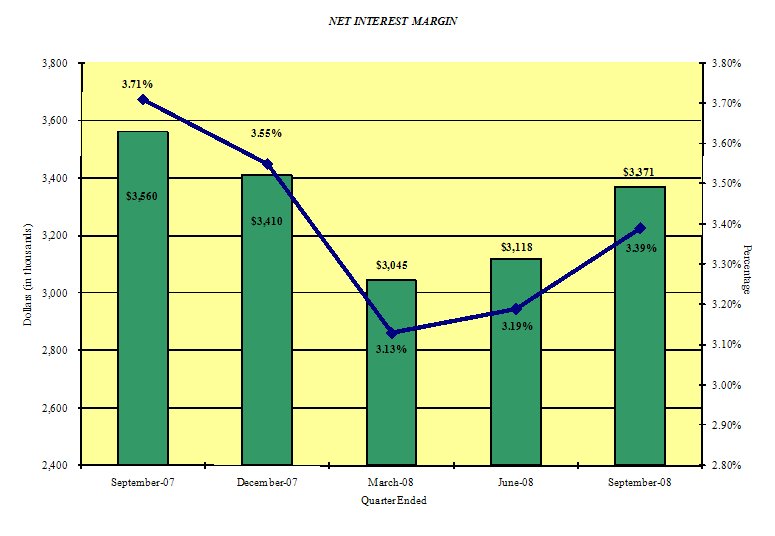
Three Months Ended:
Net interest income $ 3,371 $ 3,410 $ 3,560
Income before taxes 273 787 555
Net income 215 527 8,055
Income per common share - Basic .06 .15 2.35
Income per common share - Diluted .06 .15 2.35
Weighted average shares outstanding 3,419,736 3,428,695 3,428,695
Selected Financial Ratios and Other
Data (nine months and year ended):
Performance Ratios:
Net interest margin 3.24% 3.60% 3.62%
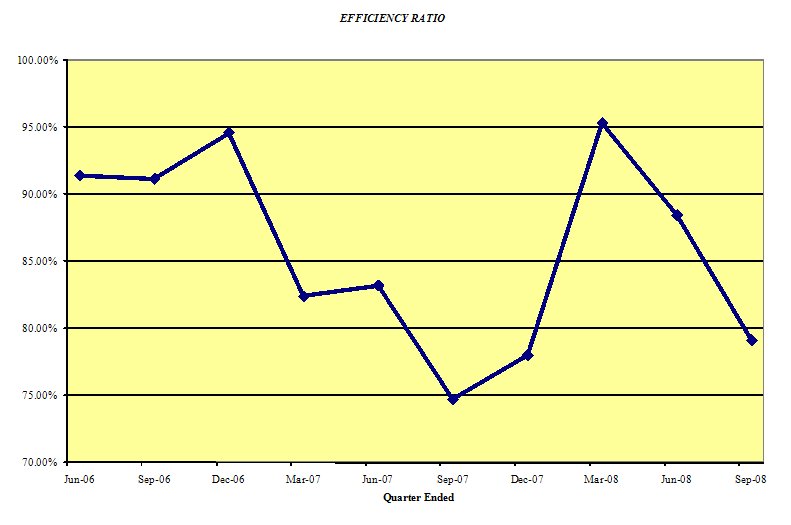
Efficiency ratio 87.36 79.46 79.94
Return on average assets .68 2.59 3.32
Return on average equity 7.03 31.05 42.07
Average total assets $ 419,891 $ 392,313 $ 387,597
Average total shareholders' equity $ 40,332 $ 32,731 $ 30,627
Average loans to average deposits
ratio 106.83% 104.94% 103.89%
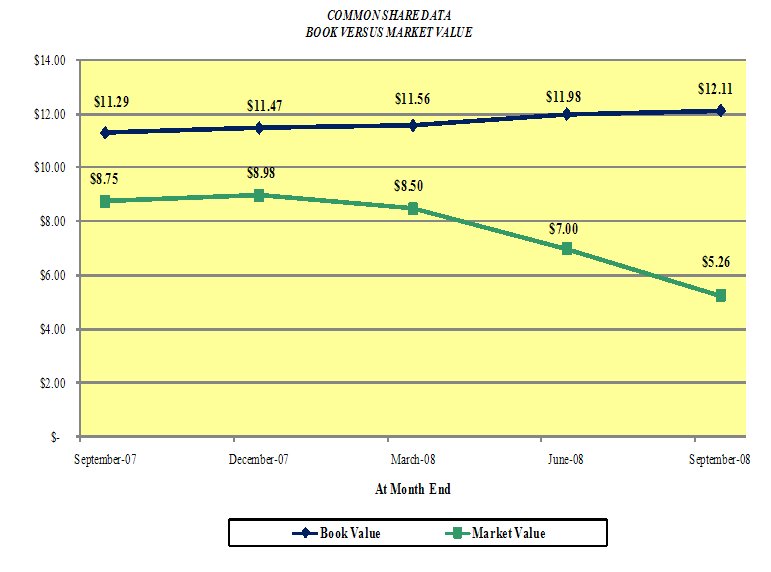
Common Share Data (at end of
period):
Market price per common share $ 5.26 $ 8.98 $ 8.75
Book value per common share $ 12.11 $ 11.47 $ 11.29
Common shares outstanding 3,419,736 3,428,695 3,428,695
Other Data (at end of period):
Allowance for loan losses $ 3,385 $ 4,146 $ 5,022
Non-performing assets $ 6,400 $ 5,234 $ 3,623
Allowance for loan losses to total
loans .94% 1.17% 1.46%
Non-performing assets to total assets 1.45% 1.28% .90%
Number of:
Branch locations 12 12 13
FTE Employees 96 100 105
MACKINAC FINANCIAL CORPORATION AND SUBSIDIARIES
CONSOLIDATED BALANCE SHEETS
September 30, December 31, September 30,
(Dollars in thousands) 2008 2007 2007
------------ ----------- ------------
(unaudited) (unaudited)
ASSETS
Cash and due from banks $ 8,217 $ 6,196 $ 7,364
Federal funds sold 4,422 166 947
------------ ----------- ------------
Cash and cash equivalents 12,639 6,362 8,311
Interest-bearing deposits in other
financial institutions 382 1,810 6,995
Securities available for sale 42,781 21,597 17,973
Federal Home Loan Bank stock 3,794 3,794 3,794
Loans:
Commercial 290,406 288,839 279,670
Mortgage 67,576 62,703 60,972
Installment 3,539 3,537 3,507
------------ ----------- ------------
Total Loans 361,521 355,079 344,149
Allowance for loan losses (3,385) (4,146) (5,022)
------------ ----------- ------------
Net loans 358,136 350,933 339,127
Premises and equipment 11,360 11,609 12,733
Other real estate held for sale 1,751 1,226 451
Other assets 10,110 11,549 11,829
------------ ----------- ------------
TOTAL ASSETS $ 440,953 $ 408,880 $ 401,213
============ =========== ============
LIABILITIES AND SHAREHOLDERS' EQUITY
Liabilities:
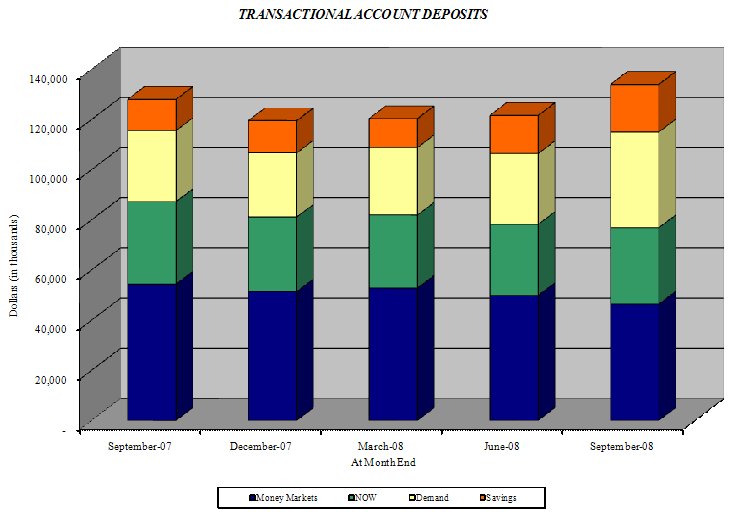
Non-interest-bearing deposits $ 34,858 $ 25,557 $ 28,325
Interest-bearing deposits:
NOW, Money Market, Checking 80,185 81,160 87,262
Savings 18,957 12,485 12,831
CDs < $100,000 74,940 80,607 90,220
CDs > $100,000 30,220 22,355 24,432
Brokered 121,534 98,663 78,301
------------ ----------- ------------
Total deposits 360,694 320,827 321,371
Borrowings:
Federal funds purchased - 7,710 -
Short-term - 1,959 -
Long-term 36,210 36,280 38,239
------------ ----------- ------------
Total borrowings 36,210 45,949 38,239
Other liabilities 2,622 2,783 2,906
------------ ----------- ------------
Total liabilities 399,526 369,559 362,516
Shareholders' equity:
Preferred stock - No par value:
Authorized 500,000 shares, no
shares outstanding
Common stock and additional paid
in capital - No par value
Authorized - 18,000,000 shares
Issued and outstanding -
3,419,736; 3,428,695; and
3,428,695 shares, respectively 42,794 42,843 42,810
Accumulated deficit (1,456) (3,582) (4,107)
Accumulated other
comprehensive income (loss) 89 60 (6)
------------ ----------- ------------
Total shareholders' equity 41,427 39,321 38,697
------------ ----------- ------------
TOTAL LIABILITIES AND SHAREHOLDERS'
EQUITY $ 440,953 $ 408,880 $ 401,213
============ =========== ============
MACKINAC FINANCIAL CORPORATION AND SUBSIDIARIES
CONSOLIDATED STATEMENTS OF OPERATIONS
Three Months Ended Nine Months Ended
September 30, September 30,
------------------ -------------------
2008 2007 2008 2007
-------- -------- --------- --------
(unaudited) (unaudited)
INTEREST INCOME:
Interest and fees on loans:
Taxable $ 5,538 $ 6,929 $ 17,241 $ 19,610
Tax-exempt 99 118 310 432
Interest on securities:
Taxable 303 263 840 857
Tax-exempt 1 - 4 -
Other interest income 88 209 257 575
-------- -------- --------- --------
Total interest income 6,029 7,519 18,652 21,474
-------- -------- --------- --------
INTEREST EXPENSE:
Deposits 2,309 3,443 7,924 9,932
Borrowings 349 516 1,194 1,535
-------- -------- --------- --------
Total interest expense 2,658 3,959 9,118 11,467
-------- -------- --------- --------
Net interest income 3,371 3,560 9,534 10,007
Provision for loan losses 450 400 1,200 400
-------- -------- --------- --------
Net interest income after provision
for loan losses 2,921 3,160 8,334 9,607
-------- -------- --------- --------
OTHER INCOME:
Service fees 229 169 597 515
Net security gains (1) - 64 -
Net gains on sale of secondary
market loans 15 165 113 364
Proceeds from settlement of
lawsuit - - 3,475 470
Other 45 62 96 302
-------- -------- --------- --------
Total other income 288 396 4,345 1,651
-------- -------- --------- --------
OTHER EXPENSE:
Salaries and employee benefits 1,533 1,695 5,416 5,106
Occupancy 336 322 1,039 983
Furniture and equipment 202 178 570 501
Data processing 212 196 649 577
Professional service fees 120 78 352 403
Loan and deposit 175 63 430 214
Telephone 41 68 125 185
Advertising 93 97 213 280
Other 224 304 803 873
-------- -------- --------- --------
Total other expenses 2,936 3,001 9,597 9,122
-------- -------- --------- --------
Income before income taxes 273 555 3,082 2,136
Provision for (benefit of) income
taxes 58 (7,500) 958 (7,500)
-------- -------- --------- --------
NET INCOME $ 215 $ 8,055 $ 2,124 $ 9,636
======== ======== ========= ========
INCOME PER COMMON SHARE:
Basic $ .06 $ 2.35 $ .62 $ 2.81
======== ======== ========= ========
Diluted $ .06 $ 2.35 $ .62 $ 2.81
======== ======== ========= ========
MACKINAC FINANCIAL CORPORATION AND SUBSIDIARIES
LOAN PORTFOLIO AND CREDIT QUALITY
(Dollars in thousands)
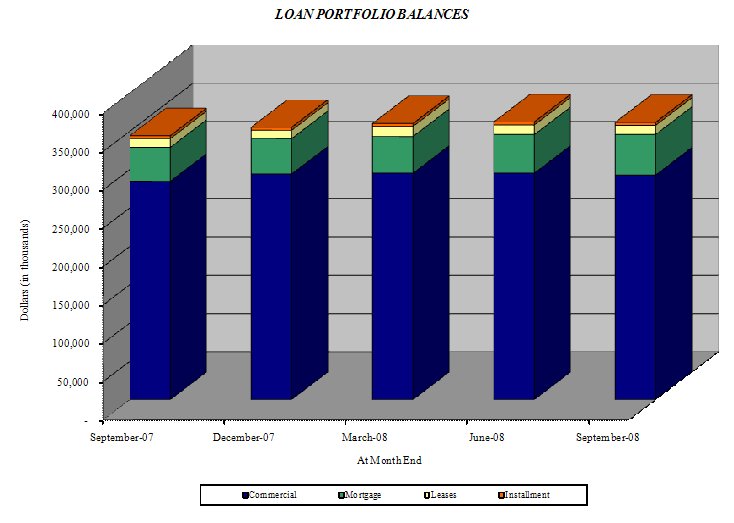
Loan Portfolio Balances (at end of period):
September 30, December 31, September 30,
2008 2007 2007
------------- ------------ -------------
(unaudited) (unaudited)
Commercial Loans:
Real estate - operators of
nonresidential buildings $ 41,486 $ 41,597 $ 43,422
Hospitality and tourism 35,287 37,604 37,479
Real estate agents and managers 29,277 29,571 25,662
Operators of nonresidential
buildings 13,352 10,569 6,471
Other 140,631 130,546 126,820
------------- ------------ -------------
Total Commercial Loans 260,033 249,887 239,854
1-4 family residential real estate 62,895 57,613 54,962
Consumer 3,539 3,537 3,507
Construction
Commercial 30,373 38,952 39,816
Consumer 4,681 5,090 6,010
------------- ------------ -------------
Total Loans $ 361,521 $ 355,079 $ 344,149
============= ============ =============
Credit Quality (at end of period):
September 30, December 31, September 30,
2008 2007 2007
------------ ----------- ------------
(unaudited) (unaudited)
Nonperforming Asset:
Nonaccrual loans $ 4,649 $ 3,298 $ 3,136
Loans past due 90 days or more - 710 36
------------ ----------- ------------
Total nonperforming loans 4,649 4,008 3,172
Other real estate owned 1,751 1,226 451
------------ ----------- ------------
Total nonperforming assets $ 6,400 $ 5,234 $ 3,623
============ =========== ============
Nonperforming loans as a % of loans 1.29% 1.13% .92%
------------ ----------- ------------
Nonperforming assets as a % of
assets 1.45% 1.28% .90%
------------ ----------- ------------
Reserve for Loan Losses:
At period end $ 3,385 $ 4,146 $ 5,022
------------ ----------- ------------
As a % of average loans .94% 1.24% 1.46%
------------ ----------- ------------
As a % of nonperforming loans 72.81% 103.44% 158.32%
------------ ----------- ------------
As a % of nonaccrual loans 72.81% 125.71% 160.14%
============ =========== ============
Charge-off Information (year to
date):
Average loans 359,729 333,415 327,810
------------ ----------- ------------
Net charge-offs 1,961 1,260 384
------------ ----------- ------------
Charge-offs as a % of average
loans .55% .38% .12%
------------ ----------- ------------
MACKINAC FINANCIAL CORPORATION AND SUBSIDIARIES
QUARTERLY FINANCIAL HIGHLIGHTS
QUARTER ENDED
-----------------------------------------------------
(Unaudited)
-----------------------------------------------------
September June 30, March 31, December September
30, 2008 2008 2008 31, 2007 30, 2007
--------- --------- --------- --------- ---------
BALANCE SHEET
(Dollars in
thousands)
Total loans $ 361,521 $ 362,122 $ 360,056 $ 355,079 $ 344,149
Allowance for loan
losses (3,385) (3,585) (3,924) (4,146) (5,022)
--------- --------- --------- --------- ---------
Total loans, net 358,136 358,537 356,132 350,933 339,127
Intangible assets 65 85 104 124 143
Total assets 440,953 437,327 417,175 408,880 401,213
Core deposits 208,940 200,293 203,445 199,809 218,638
Noncore deposits (1) 151,754 156,683 122,602 121,018 102,733
--------- --------- --------- --------- ---------
Total deposits 360,694 356,976 326,047 320,827 321,371
Total borrowings 36,210 36,280 48,849 45,949 38,239
Total shareholders'
equity 41,427 40,975 39,633 39,321 38,697
Total shares
outstanding 3,419,736 3,419,736 3,428,695 3,428,695 3,428,695
AVERAGE BALANCES
(Dollars in
thousands)
Assets $ 423,702 $ 418,246 $ 417,682 $ 406,308 $ 400,105
Loans 358,844 362,574 357,778 350,050 340,391
Deposits 341,377 332,725 336,016 324,194 327,293
Equity 41,097 40,399 39,491 38,973 32,184
INCOME STATEMENT
(Dollars in
thousands)
Net interest income $ 3,371 $ 3,118 $ 3,045 $ 3,410 $ 3,560
Provision for loan
losses 450 750 - - 400
--------- --------- --------- --------- ---------
Net interest
income after
provision 2,921 2,368 3,045 3,410 3,160
Total noninterest
income 288 3,747 310 355 396
Total noninterest
expense 2,936 3,471 3,191 2,978 3,001
--------- --------- --------- --------- ---------
Income before taxes 273 2,644 164 787 555
Provision for income
taxes 58 875 25 260 (7,500)
--------- --------- --------- --------- ---------
Net income $ 215 $ 1,769 $ 139 $ 527 $ 8,055
========= ========= ========= ========= =========
PER SHARE DATA
Earnings - basic $ .06 $ .52 $ .04 $ .15 $ 2.35
Earnings - diluted .06 .52 .04 .15 2.35
Book value 12.11 11.98 11.56 11.47 11.29
Market value, closing
price 5.26 7.00 8.50 8.98 8.75
ASSET QUALITY RATIOS
Nonperforming
loans/total loans 1.29% 1.27% .94% 1.13% .92%
Nonperforming
assets/total assets 1.45 1.83 1.08 1.28 .90
Allowance for loan
losses/total loans .94 .99 1.09 1.17 1.46
Allowance for loan
losses/nonperforming
loans 72.81 77.22 116.06 103.42 158.32
PROFITABILITY RATIOS
Return on average
assets .20% 1.70% .13% .51% 7.99%
Return on average
equity 2.08 17.62 1.42 5.36 99.30
Net interest margin 3.39 3.19 3.13 3.55 3.71
Efficiency ratio 79.12 88.45 95.34 78.02 74.71
Average loans/average
deposits 105.12 108.97 106.48 107.98 104.00
CAPITAL ADEQUACY
RATIOS
Leverage ratio 8.31% 8.56% 7.85% 8.05% 8.03%
Tier 1 capital ratio 9.40 9.48 8.84 8.97 9.03
Total capital ratio 10.31 10.45 9.92 10.13 10.28
Average
equity/average
assets 9.70 9.66 9.45 9.59 8.04
Tangible
equity/tangible
assets 9.38 9.35 9.48 9.59 9.61
(1) Noncore deposits includes Internet CDs, brokered deposits and CDs
greater than $100,000
Contact Information: Contact: Investor Relations (888) 343-8147 Website: www.bankmbank.com