Mackinac Financial Corporation Announces 2008 Results of Operations


MANISTIQUE, MI--(Marketwire - February 4, 2009) - Mackinac Financial Corporation (NASDAQ: MFNC), the holding company for mBank, has reported net income of $1.872 million, or $.55 per share, for the year ended December 31, 2008, compared to a net income of $10.163 million, or $2.96 per share, for 2007. Weighted average shares outstanding amounted to 3,422,012 in 2008 and 3,428,695 in 2007.

The 2008 results included the positive effect, $3.475 million, of a lawsuit settlement and the negative effect, $.425 million, of a severance agreement. The results for 2007 included the recognition of a $7.500 million deferred tax benefit for NOL and tax credit carryforward and $.470 million of proceeds from the settlement of a lawsuit against the Corporation's former accountants.

In 2008, we experienced one of the most difficult and trying times in modern banking history. Our results for 2008 were significantly impacted by the current economic environment. The Prime Rate, currently at 3.25%, and the overnight investment rates at near zero, provide evidence of the seriousness in which the Federal Reserve Bank views this recession. This historically low interest rate environment made it extremely difficult to maintain adequate interest margins which stymied our ability to generate earnings growth. We are not satisfied with our operating results. In 2008, we focused our efforts on watchful diligence of our current loan portfolio by shoring up potential problem credits, repricing loans to align our returns with both credit and interest rate risks and by pursuing early resolution of nonperforming assets.

At 2008 year-end, the Corporation's loans stood at $370.280 million, an increase of $15.201 million, or 4.3%, from 2007 year-end balances of $355.079 million. Total loan originations in 2008 amounted to $61.6 million. Loan amortization and principal payoffs totaled $51.2 million. A good portion of these payoffs pertained to loan relationships that no longer met our pricing or credit standards. Loan growth was primarily from the Upper Peninsula markets where the economy is more stable.

Total assets of the Corporation at December 31, 2008 were $451.431 million, an increase of $42.551 million, or 10.4% from total assets of $408.880 million reported at December 31, 2007.

Asset quality remains relatively strong when compared to our peers, particularly considering the state of the Michigan economy. Nonperforming loans totaled $4.887 million, or 1.32% of total loans at December 31, 2008. Nonperforming assets at December 31, 2008, were $7.076 million, 1.57% of total assets, compared to $5.234 million or 1.28% of total assets at December 31, 2007. However, we are not immune to the current economic crisis and we are seeing rapid change in Southeast Michigan as the auto industry and manufacturing businesses struggle to survive. This economic risk has caused us to take an extremely hard and cautious look at our entire portfolio of loans in this market and we have been aggressive in our early identification of problem credits. We increased our fourth quarter loan loss provision to provide a specific reserve for one large loan in Southeast Michigan.

Total deposits grew from $320.827 million at December 31, 2007, to $371.097 million at December 31, 2008, an increase of $50.270 million, or 15.7%. This increase is composed of an increase in wholesale brokered deposits of $52.225 million and a decline in bank deposits of $1.955 million. During 2008, we significantly increased our balance sheet liquidity which was funded primarily by issuance of brokered deposits since rates on these deposits were priced lower than in-market bank deposits. We continue to focus our efforts on growing transactional accounts. We have had success in this area as demand, money market and NOW accounts grew from $119.2 million at 2007 year-end to $121.4 million at 2008 year-end. However, overall deposit totals have fallen as we have refused to compete for CDs that are overpriced.

Net interest income for the year ended December 31, 2008 was $12.864 million compared to $13.417 million for the year ended December 31, 2007, a decrease of $.553 million. The margin percentage for 2008 was 3.23% compared to 3.60% in 2007 and 3.51% in 2006. We believe that our margin has seen its low point in December when it fell to 3.01%. During 2008, the prime rate decreased from 7.25% to 3.25%, which created significant margin pressure since a majority of the commercial loan portfolio re-priced downward with each prime rate change, which the majority of the bank's funding sources had significant lag time in re-pricing. We experienced additional margin pressure due to our brokered deposits, which did not re-price in line with prime rate reductions, due to the overall market liquidity crisis.

We recognize the importance of cost control, especially in times of economic slowdown. Excluding extraordinary items, noninterest expense totaled $12.1 million in 2008 compared to $12.1 million in 2007 and $11.6 million in 2006. Salaries and benefits were reduced from $6.8 million in 2007 to $6.5 million in 2008. Assets per employee totaled $4.6 million

Shareholders' equity totaled $41.552 million at December 31, 2008, compared to $39.321 million at the end of 2007, an increase of $2.231 million. This increase reflects consolidated net income of $1.872 million, the capital contribution impact of stock options and also the increase in equity due to the increase in the market value of held-for-sale investments, which amounted to $.385 million and the purchase of odd lot shares for $.110 million. The book value per share at December 31, 2008, amounted to $12.15 compared to $11.47 at the end of 2007.

Late in 2008, the corporation elected to apply for $11 million in equity participation under the Troubled Asset Relief Program (TARP). We have received preliminary approval from the US Treasury Department and are now evaluating the merits of the program. Participation in this program would provide additional capital for future growth during a time when other sources for additional capital are scarce and expensive.

Mackinac Financial Corporation is a registered bank holding company formed under the Bank Holding Company Act of 1956 with assets in excess of $450 million and whose common stock is traded on the NASDAQ stock market as "MFNC." The principal subsidiary of the Corporation is mBank. Headquartered in Manistique, Michigan, mBank has 12 branch locations; eight in the Upper Peninsula, three in the Northern Lower Peninsula and one in Oakland County, Michigan. The Company's banking services include commercial lending and treasury management products and services geared toward small to mid-sized businesses, as well as a full array of personal and business deposit products and consumer loans.

Forward-Looking Statements

This release contains certain forward-looking statements. Words such as "anticipates," "believes," "estimates," "expects," "intends," "should," "will," and variations of such words and similar expressions are intended to identify forward-looking statements: as defined by the Private Securities Litigation Reform Act of 1995. These statements reflect management's current beliefs as to expected outcomes of future events and are not guarantees of future performance. These statements involve certain risks, uncertainties and assumptions that are difficult to predict with regard to timing, extent, likelihood, and degree of occurrence. Therefore, actual results and outcomes may materially differ from what may be expressed or forecasted in such forward-looking statements. Factors that could cause a difference include among others: changes in the national and local economies or market conditions; changes in interest rates and banking regulations; the impact of competition from traditional or new sources; and the possibility that anticipated cost savings and revenue enhancements from mergers and acquisitions, bank consolidations, branch closings and other sources may not be fully realized at all or within specified time frames as well as other risks and uncertainties including but not limited to those detailed from time to time in filings of the Company with the Securities and Exchange Commission. These and other factors may cause decisions and actual results to differ materially from current expectations. Mackinac Financial Corporation undertakes no obligation to revise, update, or clarify forward-looking statements to reflect events or conditions after the date of this release.

            MACKINAC FINANCIAL CORPORATION AND SUBSIDIARIES
                   SELECTED FINANCIAL HIGHLIGHTS

                                                      For The Years Ended
                                                          December 31,
(Dollars in thousands, except per share data)           2008       2007
                                                      ---------  ---------
                                                    (Unaudited) (Unaudited)
Selected Financial Condition Data (at end of
 period):
Assets                                                $ 451,431  $ 408,880
Loans                                                   370,280    355,079
Investment securities                                    47,490     21,597
Deposits                                                371,097    320,827
Borrowings                                               36,210     45,949
Shareholders' equity                                     41,552     39,321


Selected Statements of Income Data:
Net interest income                                   $  12,864  $  13,417
Income before taxes                                       2,659      2,923
Net income                                                1,872     10,163
Income per common share - Basic                             .55       2.96
Income per common share - Diluted                           .55       2.96
Weighted average shares outstanding                   3,422,012  3,428,695


Selected Financial Ratios and Other Data:
Performance Ratios:
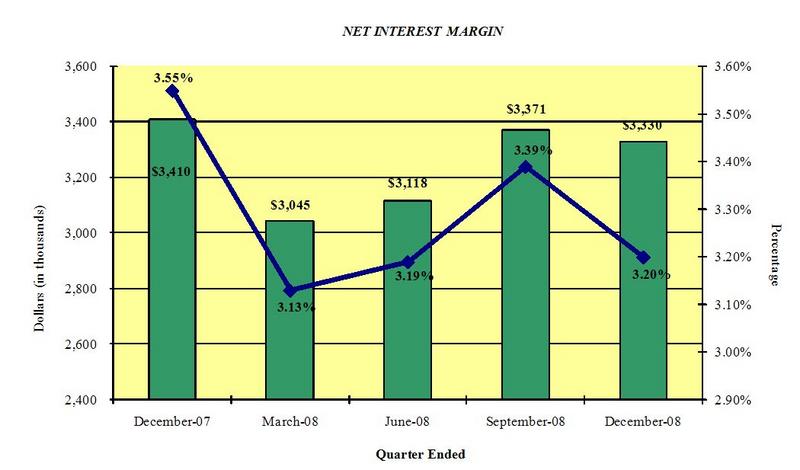
Net interest margin                                        3.23%      3.60%
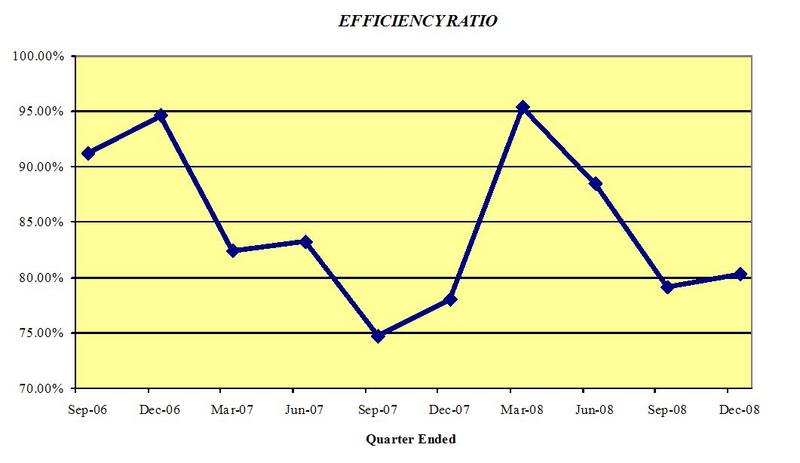
Efficiency ratio                                          85.51      79.46
Return on average assets                                    .44       2.59
Return on average equity                                   4.61      31.05

Average total assets                                  $ 425,343  $ 392,313
Average total shareholders' equity                       40,630     32,731
Average loans to average deposits ratio                  105.61%    104.94%


Common Share Data at end of period:
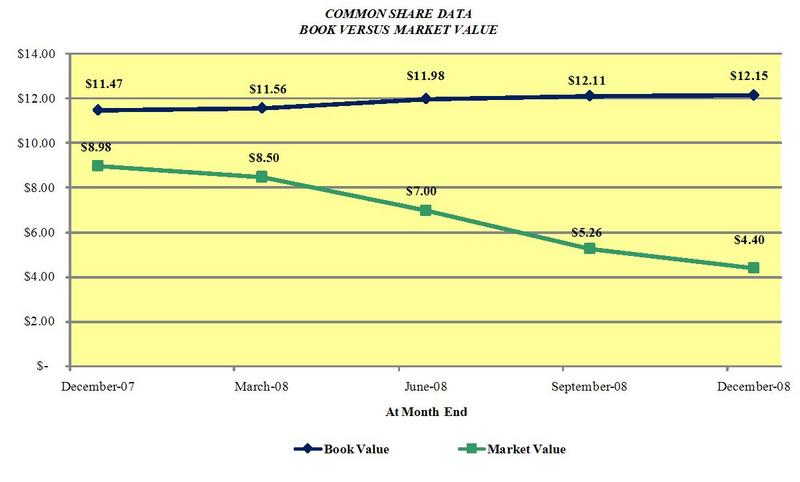
Market price per common share                         $    4.40  $    8.98
Book value per common share                           $   12.15  $   11.47
Common shares outstanding                             3,419,736  3,428,695

Other Data at end of period:
Allowance for loan losses                             $   4,277  $   4,146
Non-performing assets                                 $   7,076  $   5,234
Allowance for loan losses to total loans                   1.16%      1.17%
Non-performing assets to total assets                      1.57%      1.28%
Number of:
     Branch locations                                        12         12
     FTE Employees                                          100        100


             MACKINAC FINANCIAL CORPORATION AND SUBSIDIARIES
                     CONSOLIDATED BALANCE SHEETS

                                                       December  December
                                                          31,       31,
(Dollars in thousands)                                   2008      2007
                                                      ---------  ---------
                                                     (unaudited) (audited)
ASSETS

Cash and due from banks                               $  10,112  $   6,196
Federal funds sold                                            -        166
                                                      ---------  ---------
  Cash and cash equivalents                              10,112      6,362

Interest-bearing deposits in other financial
 institutions                                               582      1,810
Securities available for sale                            47,490     21,597
Federal Home Loan Bank stock                              3,794      3,794

Loans:
  Commercial                                            296,088    288,839
  Mortgage                                               70,447     62,703
  Installment                                             3,745      3,537
                                                      ---------  ---------
    Total Loans                                         370,280    355,079
      Allowance for loan losses                          (4,277)    (4,146)
                                                      ---------  ---------
  Net loans                                             366,003    350,933

Premises and equipment                                   11,189     11,609
Other real estate held for sale                           2,189      1,226
Other assets                                             10,072     11,549
                                                      ---------  ---------

TOTAL ASSETS                                          $ 451,431  $ 408,880
                                                      =========  =========

LIABILITIES AND SHAREHOLDERS' EQUITY
Liabilities:
  Non-interest-bearing deposits                       $  30,099  $  25,557
  Interest-bearing deposits:
    NOW, Money Market, Checking                          70,584     81,160
    Savings                                              20,730     12,485
    CDs < $100,000                                       73,752     80,607
    CDs > $100,000                                       25,044     22,355
    Brokered                                            150,888     98,663
                                                      ---------  ---------
       Total deposits                                   371,097    320,827

  Borrowings:
    Federal funds purchased                                   -      7,710
    Short-term                                                -      1,959
    Long-term                                            36,210     36,280
                                                      ---------  ---------
       Total borrowings                                  36,210     45,949
  Other liabilities                                       2,572      2,783
                                                      ---------  ---------
    Total liabilities                                   409,879    369,559

Shareholders' equity:
  Preferred stock - No par value:
    Authorized 500,000 shares, no shares outstanding
  Common stock and additional paid in capital - No
   par value
    Authorized - 18,000,000 shares
    Issued and outstanding - 3,419,736 and
     3,428,695, respectively                             42,815     42,843
    Accumulated deficit                                  (1,708)    (3,582)
    Accumulated other comprehensive income (loss)           445         60
                                                      ---------  ---------

      Total shareholders' equity                         41,552     39,321
                                                      ---------  ---------

TOTAL LIABILITIES AND SHAREHOLDERS' EQUITY            $ 451,431  $ 408,880
                                                      =========  =========


              MACKINAC FINANCIAL CORPORATION AND SUBSIDIARIES
                   CONSOLIDATED STATEMENTS OF OPERATIONS


(Dollars in thousands, except per share   For The Years Ended December 31,
data)                                           2008      2007      2006
                                              --------- --------  --------
INTEREST INCOME:                             (unaudited)(audited) (audited)
  Interest and fees on loans:
    Taxable                                   $  22,555 $ 26,340  $ 21,239
    Tax-exempt                                      404      533       753
  Interest on securities:
    Taxable                                       1,293    1,100     1,186
    Tax-exempt                                        5        -        87
  Other interest income                             305      722       787
                                              --------- --------  --------
    Total interest income                        24,562   28,695    24,052
                                              --------- --------  --------

INTEREST EXPENSE:
  Deposits                                       10,115   13,224    10,575
  Borrowings                                      1,583    2,054     1,884
                                              --------- --------  --------
    Total interest expense                       11,698   15,278    12,459
                                              --------- --------  --------

Net interest income                              12,864   13,417    11,593
Provision for loan losses                         2,300      400      (861)
                                              --------- --------  --------
Net interest income after provision for loan
 losses                                          10,564   13,017    12,454
                                              --------- --------  --------

OTHER INCOME:
  Service fees                                      838      688       547
  Net security gains                                 64        -         -
  Net gains on sale of secondary market
   loans                                            120      498       197
  Proceeds from settlement of lawsuit             3,475      470         -
  Other                                             156      350       239
                                              --------- --------  --------
    Total other income                            4,653    2,006       983
                                              --------- --------  --------

OTHER EXPENSES:
  Salaries and employee benefits                  6,886    6,757     6,132
  Occupancy                                       1,374    1,272     1,264
  Furniture and equipment                           771      678       631
  Data processing                                   844      785       691
  Professional service fees                         508      532     1,425
  Loan and deposit                                  569      285       392
  Telephone                                         170      228       210
  Advertising                                       305      370       346
  Other                                           1,131    1,193     1,130
                                              --------- --------  --------
    Total other expenses                         12,558   12,100    12,221
                                              --------- --------  --------

Income (loss) before provision for income
 taxes                                            2,659    2,923     1,216
Provision for (benefit of) income taxes             787   (7,240)     (500)
                                              --------- --------  --------
NET INCOME (LOSS)                             $   1,872 $ 10,163  $  1,716
                                              --------- --------  --------
INCOME (LOSS) PER COMMON SHARE
  Basic                                       $     .55 $   2.96  $    .50
                                              ========= ========  ========
  Diluted                                     $     .55 $   2.96  $    .50
                                              ========= ========  ========


                   MACKINAC FINANCIAL CORPORATION AND SUBSIDIARIES
                          LOAN PORTFOLIO AND CREDIT QUALITY

(Dollars in thousands)

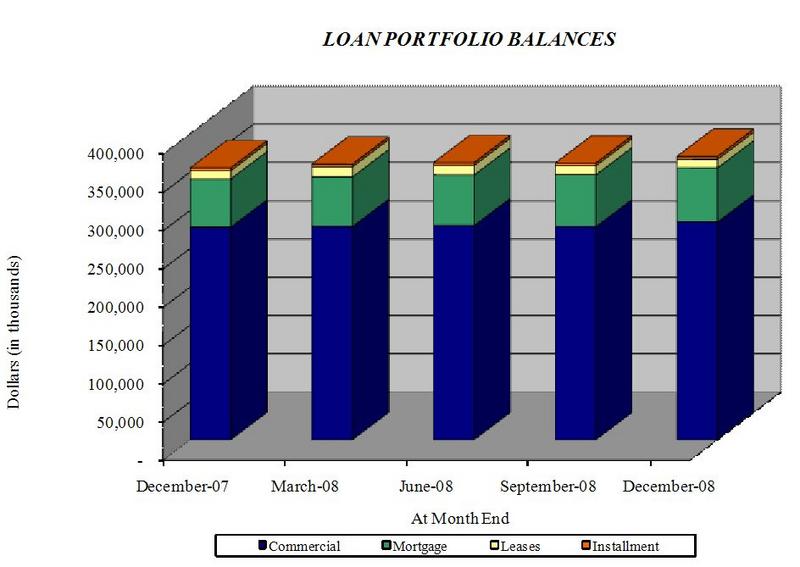
Loan Portfolio Balances (at end of period):

                                                 December 31,  December 31,
                                                     2008          2007
                                                 ------------  ------------
                                                 (unaudited)    (audited)
Commercial Loans:
Real estate - operators of nonresidential
 buildings                                       $     41,299  $     41,597
Hospitality and tourism                                35,086        37,604
Real estate agents and managers                        29,292        29,571
Operators of nonresidential buildings                  13,467        10,569
Other                                                 145,831       130,546
                                                 ------------  ------------
   Total Commercial Loans                             264,975       249,887

1-4 family residential real estate                     65,595        57,613
Consumer                                                3,745         3,537
Construction
   Commercial                                          31,113        38,952
   Consumer                                             4,852         5,090
                                                 ------------  ------------

   Total Loans                                   $    370,280  $    355,079
                                                 ============  ============


Credit Quality (at end of period):


                                                 December 31,  December 31,
                                                     2008          2007
                                                 -----------   -----------
                                                 (unaudited)    (audited)
Nonperforming Assets :
Nonaccrual loans                                 $     4,887   $     3,298
Loans past due 90 days or more                             -           710
                                                 -----------   -----------
   Total nonperforming loans                           4,887         4,008
Other real estate owned                                2,189         1,226
                                                 -----------   -----------
   Total nonperforming assets                    $     7,076   $     5,234
                                                 ===========   ===========
Nonperforming loans as a % of loans                     1.32%         1.13%
                                                 -----------   -----------
Nonperforming assets as a % of assets                   1.57%         1.28%
                                                 -----------   -----------
Reserve for Loan Losses:
At period end                                    $     4,277   $     4,146
                                                 -----------   -----------
As a % of average loans                                 1.18%         1.24%
                                                 -----------   -----------
As a % of nonperforming loans                          87.52%       103.44%
                                                 -----------   -----------
As a % of nonaccrual loans                             87.52%       125.71%
                                                 ===========   ===========

Charge-off Information (year to date):
   Average loans                                     361,324       333,415
                                                 -----------   -----------
   Net charge-offs                                     2,168         1,260
                                                 -----------   -----------
   Charge-offs as a % of average loans                   .60%          .38%
                                                 -----------   -----------


            MACKINAC FINANCIAL CORPORATION AND SUBSIDIARIES
                    QUARTERLY FINANCIAL HIGHLIGHTS


                               QUARTER ENDED
                                (Unaudited)

                 December   September                            December
                    31,         30,      June 30,   March 31,       31,
                   2008        2008        2008        2008        2007
                ---------   ----------  ----------  ----------  ----------
BALANCE SHEET
 (Dollars in
  thousands)

Total loans     $ 370,280   $  361,521  $  362,122  $  360,056  $  355,079
Allowance for
 loan losses       (4,277)      (3,385)     (3,585)     (3,924)     (4,146)
                ---------   ----------  ----------  ----------  ----------
   Total loans,
    net           366,003      358,136     358,537     356,132     350,933
Intangible
 assets                46           65          85         104         124
Total assets      451,431      440,953     437,327     417,175     408,880
Core deposits     195,165      208,940     200,293     203,445     199,809
Noncore
 deposits (1)     175,932      151,754     156,683     122,602     121,018
                ---------   ----------  ----------  ----------  ----------
   Total
    deposits      371,097      360,694     356,976     326,047     320,827
Total
 borrowings        36,210       36,210      36,280      48,849      45,949
Total
 shareholders'
 equity            41,552       41,427      40,975      39,633      39,321
Total shares
 outstanding    3,419,736    3,419,736   3,419,736   3,428,695   3,428,695

AVERAGE BALANCES
 (Dollars in
  thousands)

Assets          $ 441,583   $  423,702  $  418,246  $  417,682  $  406,308
Loans             366,077      358,844     362,574     357,778     350,050
Deposits          358,213      341,377     332,725     336,016     324,194
Equity             41,516       41,097      40,399      39,491      38,973

INCOME STATEMENT
 (Dollars in
  thousands)

Net interest
 income         $   3,330   $    3,371  $    3,118  $    3,045  $    3,410
Provision for
 loan losses        1,100          450         750           -           -
                ---------   ----------  ----------  ----------  ----------
   Net interest
    income
    after
    provision       2,230        2,921       2,368       3,045       3,410
Total
 noninterest
 income               308          288       3,747         310         355
Total
 noninterest
 expense            2,961        2,935       3,471       3,191       2,978
                ---------   ----------  ----------  ----------  ----------
Income before
 taxes               (423)         274       2,644         164         787
Provision for
 income taxes        (171)          58         875          25         260
                ---------   ----------  ----------  ----------  ----------
Net income      $    (252)  $      216  $    1,769  $      139  $      527
                =========   ==========  ==========  ==========  ==========

PER SHARE DATA

Earnings -
 basic          $    (.07)  $      .06  $      .52  $      .04  $      .15
Earnings -
 diluted             (.07)         .06         .52         .04         .15
Book value          12.15        12.11       11.98       11.56       11.47
Market value,
 closing price       4.40         5.26        7.00        8.50        8.98

ASSET QUALITY RATIOS

Nonperforming
 loans/total
 loans               1.32%        1.29%       1.27%        .94%       1.13%
Nonperforming
 assets/total
 assets              1.57         1.45        1.83        1.08        1.28
Allowance for
 loan losses/
 total loans         1.16          .94         .99        1.09        1.17
Allowance for
 loan losses/
 nonperforming
 loans              87.52        72.81       77.22      116.06      103.42

PROFITABILITY RATIOS

Return on
 average assets      (.23)%        .20%       1.70%        .13%        .51%
Return on
 average equity     (2.42)        2.08       17.62        1.42        5.36
Net interest
 margin              3.20         3.39        3.19        3.13        3.55
Efficiency
 ratio              80.30        79.12       88.45       95.34       78.02
Average loans/
 average deposits  102.20       105.12      108.97      106.48      107.98

CAPITAL ADEQUACY RATIOS

Leverage ratio       8.01%        8.31%       8.56%       7.85%       8.05%
Tier 1 capital
 ratio               9.25         9.40        9.48        8.84        8.97
Total capital
 ratio              10.38        10.31       10.45        9.92       10.13
Average
 equity/average
 assets              9.40         9.70        9.66        9.45        9.59
Tangible
 equity/tangible
 assets              9.20         9.38        9.35        9.48        9.59

(1) Noncore deposits includes Internet CDs, brokered deposits and CDs
    greater than $100,000

Contact Information: Contact: Investor Relations (888) 343-8147 Website: www.bankmbank.com