Mackinac Financial Corporation Reports First Quarter 2009 Results


MANISTIQUE, MI--(Marketwire - April 30, 2009) - Mackinac Financial Corporation (NASDAQ: MFNC), the bank holding company for mBank (the "Bank") today announced first quarter 2009 income of $.090 million or $.03 per share compared to net income of $.139 million, or $.04 per share for the first quarter of 2008. Operating results for the first quarter of 2009 included a provision for loan losses of $.550 million. There was no provision for the first quarter of 2008. Weighted average shares outstanding amounted to 3,419,736 in the first quarter of 2009 and 3,428,695 in the first quarter of 2008.

Net interest margin in the first quarter of 2009 increased to $3.495 million, or 3.35%, compared to $3.045 million, or 3.13%, in the first quarter of 2008. This increase was primarily due to a reduction in funding costs between periods, as interest rates on brokered deposits declined. Paul Tobias, Chairman and Chief Executive Officer, commented, "We are pleased with the improvement in our net interest margin, which reflects not only the benefits received from decreased pricing on wholesale deposits, but also the positive impact of our disciplined internal loan and deposit pricing. In this low interest rate environment, we have been diligent in setting interest rate floors on loans and have aggressively lowered rates on deposit products, which will translate into increased margin contribution in future periods."

Noninterest income, at $.391 million in the first quarter of 2009, increased $.081 million from the first quarter 2008 level of $.310 million, largely due to increased service fees. Noninterest expense of $3.239 million reflects an increase in FDIC insurance premiums of $.116 million for the first quarter of 2009 and in total showed a moderate increase of $.048 million, or 1.5%, from the first quarter of 2008.

Total assets of the Corporation at March 31, 2009 were $466.375 million, up 11.79% from the $417.175 million in total assets reported at March 31, 2008. First quarter 2009 total assets were up 3.31% from the $451.431 million of total assets at year end 2008.

Total loans at March 31, 2009 were $370.776 million, a 2.98% increase from the $360.056 million at March 31, 2008. Total loans at the end of the first quarter of 2009 were up slightly from year-end 2008 total loans of $370.280 million. Tobias stated, "Loan growth in the first quarter was impacted by $14.425 million in paydowns; however, our first quarter new loan production was relatively strong at $9.390 million, with almost all new production occurring in the Upper Peninsula, which has not had the severe level of economic downturn that other parts of the state have experienced. We will be seeking loan growth opportunities in 2009 but will continue to adhere to our strict credit standards and pricing."

Total deposits of $385.757 million at March 31, 2009 were up 18.31% from deposits of $326.047 million on March 31, 2008. Deposits were up 3.95% from year-end 2008 deposits of $371.097 million. Deposit growth increases in the 2009 first quarter were due to increases in wholesale brokered deposits of $11.123 million and growth in bank deposits of $3.537 million, primarily low cost transactional deposits. Deposit balances increased by $59.710 million from March 2008 to March 2009, with increased brokered deposits accounting for substantially all of the growth.

Nonperforming assets at the end of the first quarter of 2009 totaled $15.252 million which was up $8.176 million from 2008 year end balances. The increase in nonperforming assets in the first quarter includes two large commercial credit relationships in Southeast Michigan, with a total balance of $5.8 million. Tobias, commenting on credit quality, stated, "The Southeastern Michigan market continues to weaken. Real estate values have fallen rapidly. Our additions to nonperforming assets reflect two credits where original collateral values have decreased to the point where we needed to add to our reserve for loan losses. We are actively involved with these borrowers and are taking all necessary steps to collect our principal and minimize earnings impact."

Shareholders' equity at March 31, 2009 totaled $41.864 million, or $12.24 per share, compared to $39.633 million, or $11.56 per share on March 31, 2008.

Tobias concluded, "We start 2009 with a cautious, but positive outlook for the future. Our net interest margin will provide a solid platform for enhanced earnings; however, we are concerned about the economy, which continues to stress our borrowers. Late in April, we received the $11 million proceeds from the issuance of Series A Preferred Stock to the U.S. Treasury. This capital will be used to increase the strong capital position of the Bank. The Bank will use the capital to grow loans. In addition, the capital will allow the Corporation to consider acquisitions of deposit franchises that would enhance our funding mix."

Mackinac Financial Corporation is a registered bank holding company formed under the Bank Holding Company Act of 1956 with assets in excess of $450 million and whose common stock is traded on the NASDAQ stock market as "MFNC." The principal subsidiary of the Corporation is mBank. Headquartered in Manistique, Michigan, mBank has 13 branch locations; nine in the Upper Peninsula, three in the Northern Lower Peninsula and one in Oakland County, Michigan. The Company's banking services include commercial lending and treasury management products and services geared toward small to mid-sized businesses, as well as a full array of personal and business deposit products and consumer loans.

Forward-Looking Statements

This release contains certain forward-looking statements. Words such as "anticipates," "believes," "estimates," "expects," "intends," "should," "will," and variations of such words and similar expressions are intended to identify forward-looking statements: as defined by the Private Securities Litigation Reform Act of 1995. These statements reflect management's current beliefs as to expected outcomes of future events and are not guarantees of future performance. These statements involve certain risks, uncertainties and assumptions that are difficult to predict with regard to timing, extent, likelihood, and degree of occurrence. Therefore, actual results and outcomes may materially differ from what may be expressed or forecasted in such forward-looking statements. Factors that could cause a difference include among others: changes in the national and local economies or market conditions; changes in interest rates and banking regulations; the impact of competition from traditional or new sources; and the possibility that anticipated cost savings and revenue enhancements from mergers and acquisitions, bank consolidations, branch closings and other sources may not be fully realized at all or within specified time frames as well as other risks and uncertainties including but not limited to those detailed from time to time in filings of the Company with the Securities and Exchange Commission. These and other factors may cause decisions and actual results to differ materially from current expectations. Mackinac Financial Corporation undertakes no obligation to revise, update, or clarify forward-looking statements to reflect events or conditions after the date of this release.

               MACKINAC FINANCIAL CORPORATION AND SUBSIDIARIES
                      SELECTED FINANCIAL HIGHLIGHTS

 (Dollars in thousands, except per share data)


                                             For The Period Ended
                                   ---------------------------------------
                                    March 31,    December 31,    March 31,
                                       2009          2008          2008
                                   -----------   -----------   -----------
                                   (Unaudited)                 (Unaudited)
Selected Financial Condition Data
 (at end of period):
Assets                             $   466,375   $   451,431   $   417,175
Loans                                  370,776       370,280       360,056
Investment securities                   51,071        47,490        24,581
Deposits                               385,757       371,097       326,047
Borrowings                              36,210        36,210        48,849
Shareholders' Equity                    41,864        41,552        39,633


Selected Statements of Income
 Data:
Net interest income                $     3,495   $    12,864   $     3,045
Income before taxes                         97         2,659           164
Net income                                  90         1,872           139
Income per common share - Basic            .03           .55           .04
Income per common share - Diluted          .03           .55           .04
Weighted average shares
 outstanding                         3,419,736     3,422,012     3,428,695


Selected Financial Ratios and
 Other Data:
Performance Ratios:
Net interest margin                       3.35%         3.23%         3.13%
Efficiency ratio                         82.36         85.51         95.34
Return on average assets                   .08           .44           .13
Return on average equity                   .87          4.61          1.42

Average total assets               $   454,741   $   425,343   $   417,682
Average total shareholders' equity      41,813        40,630        39,491
Average loans to average deposits
 ratio                                   99.54%       105.61%       106.48%


Common Share Data (at end of
 period):
Market price per common share      $      4.00   $      4.40   $      8.50
Book value per common share        $     12.24   $     12.15   $     11.56
Common shares outstanding            3,419,736     3,419,736     3,428,695

Other Data (at end of period):
Allowance for loan losses          $     4,793   $     4,277   $     3,924
Non-performing assets              $    15,252   $     7,076   $     4,518
Allowance for loan losses to total
 loans                                    1.29%         1.16%         1.09%
Non-performing assets to total
 assets                                   3.27%         1.57%         1.08%
Number of:
     Branch locations                       13            12            12
     FTE Employees                         101           100           103


               MACKINAC FINANCIAL CORPORATION AND SUBSIDIARIES
                      CONSOLIDATED BALANCE SHEETS


                                    March 31,    December 31,    March 31,
(Dollars in thousands)                 2009          2008          2008
                                   -----------   -----------   -----------
                                   (unaudited)                 (unaudited)
ASSETS

Cash and due from banks            $    21,394   $    10,112   $     6,849
Federal funds sold                           -             -         1,568
                                   -----------   -----------   -----------
   Cash and cash equivalents            21,394        10,112         8,417

Interest-bearing deposits in other
 financial institutions                    569           582           382
Securities available for sale           51,071        47,490        24,581
Federal Home Loan Bank stock             3,794         3,794         3,794

Loans:
   Commercial                          295,595       296,088       291,980
   Mortgage                             71,554        70,447        64,624
   Installment                           3,627         3,745         3,452
                                   -----------   -----------   -----------
     Total Loans                       370,776       370,280       360,056
       Allowance for loan losses        (4,793)       (4,277)       (3,924)
                                   -----------   -----------   -----------
   Net loans                           365,983       366,003       356,132

Premises and equipment                  11,134        11,189        11,511
Other real estate held for sale          2,199         2,189         1,137
Other assets                            10,231        10,072        11,221
                                   -----------   -----------   -----------

TOTAL ASSETS                       $   466,375   $   451,431   $   417,175
                                   ===========   ===========   ===========

LIABILITIES AND SHAREHOLDERS'
 EQUITY

LIABILITIES:
Deposits:
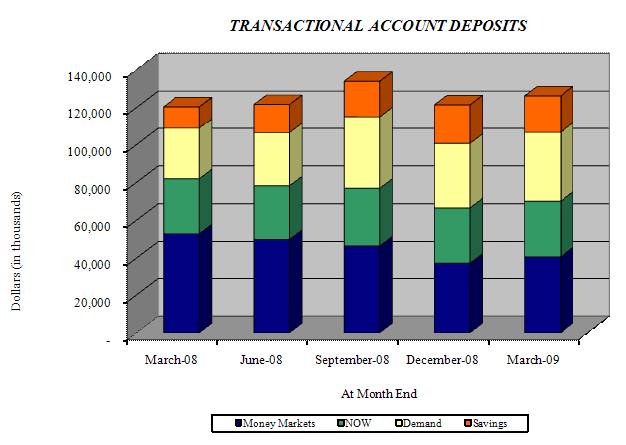
   Noninterest bearing deposits    $    31,541   $    30,099   $    26,876
   NOW, money market, checking          75,026        70,584        81,952
   Savings                              19,585        20,730        11,530
   CDs < $100,000                       70,708        73,752        83,087
   CDs > $100,000                       26,886        25,044        22,010
   Brokered                            162,011       150,888       100,592
                                   -----------   -----------   -----------
       Total deposits                  385,757       371,097       326,047

Borrowings:
     Federal funds purchased                 -             -        10,410
     Short-term                              -             -         2,159
     Long-term                          36,210        36,210        36,280
                                   -----------   -----------   -----------
       Total borrowings                 36,210        36,210        48,849
Other liabilities                        2,544         2,572         2,646
                                   -----------   -----------   -----------
     Total liabilities                 424,511       409,879       377,542

SHAREHOLDERS' EQUITY:
   Preferred stock - No par value:
     Authorized 500,000 shares, no
      shares outstanding
   Common stock and additional
    paid in capital - No par value
     Authorized - 18,000,000
       shares
     Issued and outstanding -
      3,419,736; 3,419,736, and
      3,428,695 respectively            42,833        42,815        42,862
     Accumulated deficit                (1,619)       (1,708)       (3,441)
     Accumulated other
      comprehensive income (loss)          650           445           212
                                   -----------   -----------   -----------

       Total shareholders' equity       41,864        41,552        39,633
                                   -----------   -----------   -----------

TOTAL LIABILITIES AND
 SHAREHOLDERS' EQUITY              $   466,375   $   451,431   $   417,175
                                   ===========   ===========   ===========


               MACKINAC FINANCIAL CORPORATION AND SUBSIDIARIES
                   CONSOLIDATED STATEMENTS OF OPERATIONS


                                                     Three Months Ended
                                                         March 31,
                                                 --------------------------
(Dollars in thousands except per share data)         2009          2008
                                                 ------------  ------------
                                                 (Unaudited)   (Unaudited)
INTEREST INCOME:
  Interest and fees on loans:
     Taxable                                     $      5,002  $      6,100
     Tax-exempt                                            90           108
  Interest on securities:
     Taxable                                              459           266
     Tax-exempt                                             1             1
  Other interest income                                     2            89
                                                 ------------  ------------
     Total interest income                             5,554         6,564
                                                 ------------  ------------

INTEREST EXPENSE:
  Deposits                                              1,778         3,065
  Borrowings                                              281           454
                                                 ------------  ------------
     Total interest expense                             2,059         3,519
                                                 ------------  ------------

Net interest income                                     3,495         3,045
Provision for loan losses                                 550             -
                                                 ------------  ------------
Net interest income after provision for loan
 losses                                                 2,945         3,045
                                                 ------------  ------------

NONINTEREST INCOME:
  Service fees                                            243           174
  Net security gains                                        -            65
  Net gains on sale of secondary market loans              58            48
  Other                                                    90            23
                                                 ------------  ------------
    Total noninterest income                              391           310
                                                 ------------  ------------

NONINTEREST EXPENSE:
  Salaries and employee benefits                        1,597         1,807
  Occupancy                                               378           355
  Furniture and equipment                                 189           178
  Data processing                                         220           221
  Professional service fees                               153           153
  Loan and deposit                                        261           110
  Telephone                                                43            45
  Advertising                                              78            60
  Other                                                   320           262
                                                 ------------  ------------
    Total noninterest expense                           3,239         3,191
                                                 ------------  ------------

Income before provision for income taxes                   97           164
Provision for income taxes                                  7            25
                                                 ------------  ------------

NET INCOME                                       $         90  $        139
                                                 ============  ============
INCOME PER COMMON SHARE:
  Basic                                          $        .03  $        .04
                                                 ============  ============
  Diluted                                        $        .03  $        .04
                                                 ============  ============


                MACKINAC FINANCIAL CORPORATION AND SUBSIDIARIES
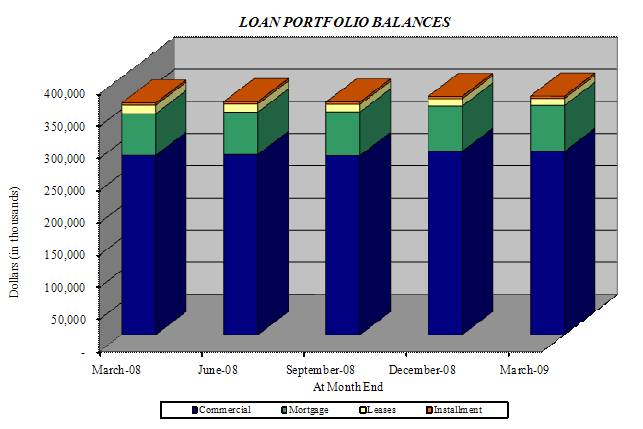
                    LOAN PORTFOLIO AND CREDIT QUALITY

(Dollars in thousands)

Loan Portfolio Balances (at end of period):


                                        March 31,   December 31, March 31,
                                           2009        2008        2008
                                        ----------- ----------- -----------
Commercial Loans
Real estate - operators of
 nonresidential buildings               $    40,457 $    41,299 $    43,167
Hospitality and tourism                      35,224      35,086      35,760
Real estate agents and managers              28,012      29,292      30,235
Operators of nonresidential buildings        13,512      13,467       9,039
Other                                       151,732     145,831     146,226
                                        ----------- ----------- -----------
   Total Commercial Loans                   268,937     264,975     264,427

1-4 family residential real estate           65,792      65,595      59,532
Consumer                                      3,627       3,745       3,452
Construction
   Commercial                                26,658      31,113      27,553
   Consumer                                   5,762       4,852       5,092
                                        ----------- ----------- -----------

   Total Loans                          $   370,776 $   370,280 $   360,056
                                        =========== =========== ===========

Credit Quality (at end of period):


                                        March 31,  December 31,  March 31,
                                           2009        2008        2008
                                        ----------  ----------  ----------
Nonperforming Assets:
Nonaccrual loans                        $   12,461  $    4,887  $    3,381
Loans past due 90 days or more                   -           -           -
Restructured loans                             592           -           -
                                        ----------  ----------  ----------
   Total nonperforming loans                13,053       4,887       3,381
Other real estate owned                      2,199       2,189       1,137
                                        ----------  ----------  ----------
   Total nonperforming assets           $   15,252  $    7,076  $    4,518
                                        ==========  ==========  ==========
Nonperforming loans as a % of loans           3.52%       1.32%        .94%
                                        ----------  ----------  ----------
Nonperforming assets as a % of assets         3.27%       1.57%       1.08%
                                        ----------  ----------  ----------
Reserve for Loan Losses:
At period end                           $    4,793  $    4,277  $    3,924
                                        ----------  ----------  ----------
As a % of loans                               1.29%       1.16%       1.09%
                                        ----------  ----------  ----------
As a % of nonperforming loans                36.72%      87.52%     116.06%
                                        ----------  ----------  ----------
As a % of nonaccrual loans                   38.46%      87.52%     116.06%
                                        ==========  ==========  ==========

Charge-off Information (year to date):
   Average loans                           370,943     361,324     357,778
                                        ----------  ----------  ----------
   Net charge-offs                              34       2,169         222
                                        ----------  ----------  ----------
   Charge-offs as a % of average loans         .01%        .60%        .06%
                                        ----------  ----------  ----------


                 MACKINAC FINANCIAL CORPORATION AND SUBSIDIARIES
                          QUARTERLY FINANCIAL HIGHLIGHTS
                                December   September
                    March 31,      31,        30,     June 30,   March 31,
                      2009        2008       2008       2008       2008
                    ---------  ---------   ---------  ---------  ---------
BALANCE SHEET
 (Dollars in
 thousands)

Total loans         $ 370,776  $ 370,280   $ 361,521  $ 362,122  $ 360,056
Allowance for loan
 losses                (4,793)    (4,277)     (3,385)    (3,585)    (3,924)
                    ---------  ---------   ---------  ---------  ---------
   Total loans, net   365,983    366,003     358,136    358,537    356,132
Intangible assets          26         46          65         85        104
Total assets          466,375    451,431     440,953    437,327    417,175
Core deposits         196,860    195,165     208,940    200,293    203,445
Noncore deposits (1)  188,897    175,932     151,754    156,683    122,602
                    ---------  ---------   ---------  ---------  ---------
   Total deposits     385,757    371,097     360,694    356,976    326,047
Total borrowings       36,210     36,210      36,210     36,280     48,849
Total shareholders'
 equity                41,864     41,552      41,427     40,975     39,633
Total shares
 outstanding        3,419,736  3,419,736   3,419,736  3,419,736  3,428,695

AVERAGE BALANCES
 (Dollars in
 thousands)

Assets              $ 454,741  $ 441,583   $ 423,702  $ 418,246  $ 417,682
Loans                 370,943    366,077     358,844    362,574    357,778
Deposits              372,670    358,213     341,377    332,725    336,016
Equity                 41,813     41,516      41,097     40,399     39,491

INCOME STATEMENT
 (Dollars in
 thousands)

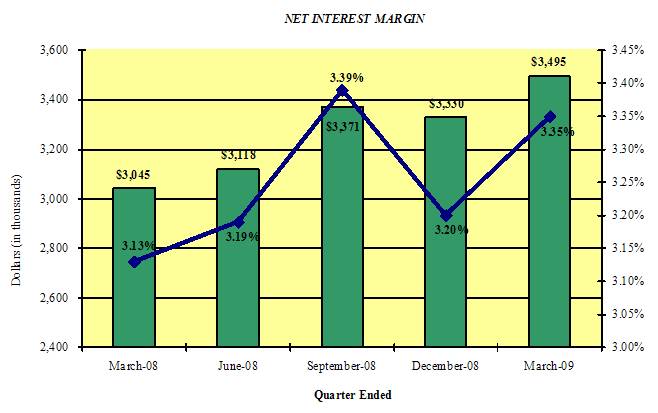
Net interest income $   3,495  $   3,330   $   3,371  $   3,118  $   3,045
Provision for loan
 losses                   550      1,100         450        750          -
                    ---------  ---------   ---------  ---------  ---------
   Net interest
    income after
    provision           2,945      2,230       2,921      2,368      3,045
Total noninterest
 income                   391        308         288      3,747        310
Total noninterest
 expense                3,239      2,961       2,935      3,471      3,191
                    ---------  ---------   ---------  ---------  ---------
Income before taxes        97       (423)        274      2,644        164
Provision for
 income taxes               7       (171)         58        875         25
                    ---------  ---------   ---------  ---------  ---------
Net income          $      90  $    (252)  $     216  $   1,769  $     139
                    =========  =========   =========  =========  =========

PER SHARE DATA

Earnings - basic    $     .03  $    (.07)  $     .06  $     .52  $     .04
Earnings - diluted        .03       (.07)        .06        .52        .04
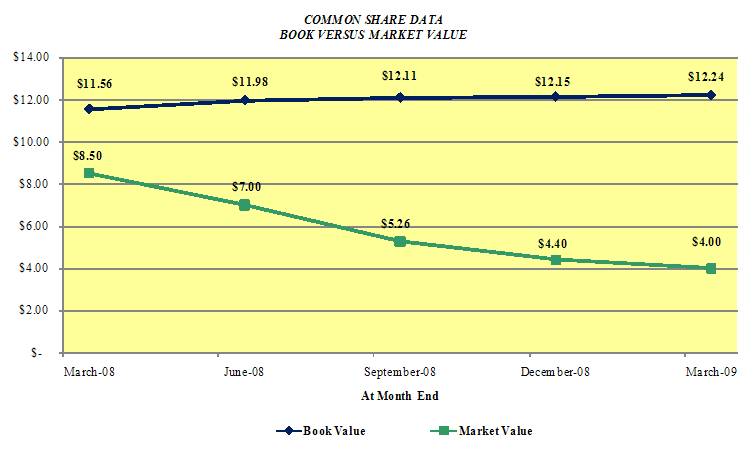
Book value              12.24      12.15       12.11      11.98      11.56
Market value,
 closing price           4.00       4.40        5.26       7.00       8.50

ASSET QUALITY
 RATIOS

Nonperforming
 loans/total loans       3.52%      1.32 %      1.29%      1.27%       .94%
Nonperforming
 assets/total
 assets                  3.27       1.57        1.45       1.83       1.08
Allowance for loan
 losses/total loans      1.29       1.16         .94        .99       1.09
Allowance for loan
 losses/nonperform-
 ing loans              36.72      87.52       72.81      77.22     116.06

PROFITABILITY
 RATIOS

Return on average
 assets                   .08%      (.23)%       .20%      1.70%       .13%
Return on average
 equity                   .87      (2.42)       2.08      17.62       1.42
Net interest margin      3.35       3.20        3.39       3.19       3.13
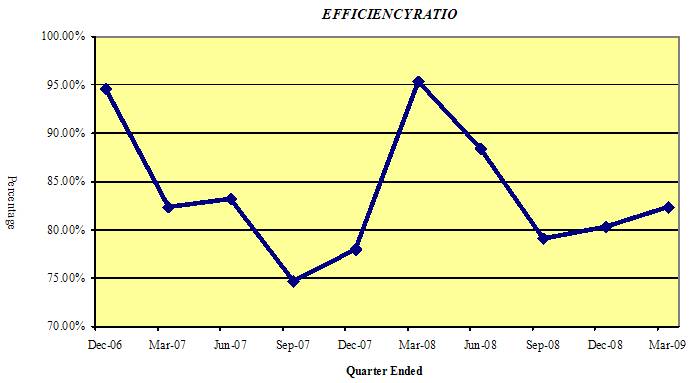
Efficiency ratio        82.36      80.30       79.12      88.45      95.34
Average
 loans/average
 deposits               99.54     102.20      105.12     108.97     106.48

CAPITAL ADEQUACY
 RATIOS

Tier 1 leverage
 ratio                   7.86%      8.01 %      8.31%      8.56%      7.85%
Tier 1 capital to
 risk weighted
 assets                  9.31       9.25        9.40       9.48       8.84
Total capital to
 risk weighted
 assets                 10.56      10.38       10.31      10.45       9.92
Average
 equity/average
 assets                  9.20       9.40        9.70       9.66       9.45
Tangible
 equity/tangible
 assets                  8.97       9.20        9.38       9.35       9.48

(1)  Noncore deposits includesInternet CDs, brokered deposits and CDs
     greater than $100,000


Contact Information: Contact: Investor Relations (888) 343-8147 Website: www.bankmbank.com