Mackinac Financial Corporation Reports Second Quarter and Six Months 2009 Results


MANISTIQUE, MI--(Marketwire - July 30, 2009) - Mackinac Financial Corporation (NASDAQ: MFNC), the bank holding company for mBank (the "Bank") today announced second quarter 2009 income of $.461 million or $.13 per share compared to net income of $1.769 million, or $.52 per share for the second quarter of 2008. Net income for the first six months of 2009 totaled $.551 million, or $.16 per share, compared to $1.908 million, or $.56 per share, for the same period in 2008.

The quarter and six month results for 2009 includes the FDIC special assessment which was charged to all banking organizations based upon asset size, and amounted to $.215 million for mBank. The quarter and six month results for 2008 include the positive effect, $3.475 million, of a lawsuit settlement and the negative effects, $.425 million, of a severance agreement. Operating results for the six month period in 2009 include the $.700 million provision compared to $.750 million in the same period in 2008. Excluding the FDIC special assessment for 2009 and the lawsuit settlement and severance payment in 2008, our adjusted six month net income in 2009 would be $.691 million, or $.20 income per share compared to a loss of $.213 million, or a loss of $.06 per share in the 2008 six month period.

Weighted average shares totaled 3,419,736 year to date and for the second quarter in 2009 compared to 3,424,314 for the six month period and 3,419,935 at the second quarter of 2008.

Net interest margin in the second quarter of 2009 increased to $4.051 million, or 3.58% compared to $3.118 million, or 3.19% in the second quarter of 2008. For the six month period the net interest margin totaled $7.546 million, or 3.47% compared to $6.163 million or 3.16% for the same period in 2008. This increased margin was due to a combination of a significant reduction in funding costs partially offset by decreased rates on earning assets. Paul Tobias, Chairman and Chief Executive officer, commented, "We are pleased with the continued improvement in our net interest margin, which reflects pricing discipline on new and renewed loans in addition to the lower rates on wholesale deposits. We expect this trend to continue."

Noninterest income totaled $.439 million in the second quarter of 2009, compared to $3.747 million the first quarter 2008. Included in noninterest income for the second quarter and six months ended periods of 2008 was the $3.475 million lawsuit settlement. Excluding this settlement, 2009 six month noninterest income exceeded 2008 by $.258 million, or 44.33%. Noninterest expense in the second quarter and for the six month period of 2009 was relatively unchanged from 2008 levels when excluding the increase in FDIC insurance premiums of $.331 million in 2009 and the severance payment of $.425 million incurred in 2008.

Total assets of the Corporation at June 30, 2009 were $506.304 million, up $68.977 million, or 15.77% from the $437.327 million in total assets reported at June 30, 2008 and up $54.873 million, or 12.16%, from total assets of $451.431 million at year-end 2008. Asset totals at June 30, 2009 reflect increased balances of investment securities of approximately $48 million.

Loans at June 30, 2009 totaled $372.004 million, a 2.73% increase from the $362.122 million at June 30, 2008, and a slight increase from year-end loans of $370.280 million. Kelly George, President and Chief Executive Officer of mBank, stated, "Loan growth in the first half was retarded by large paydowns amounting to $9.2 million, along with normal loan principal reductions of $15.3 million. Given the current economic environment, and tough requirements for loan pricing and credit quality, we are pleased with current year to date production which totaled $34.2 million with approximately 67% originating in the Upper Peninsula. In general, the Upper Peninsula has not experienced the economic downturn and collateral deterioration that has occurred elsewhere in Michigan. We continue to see loan opportunities, not only in the Upper Peninsula, but also in lower Michigan, as competitive banks withdraw from Michigan opportunities. Our current pipeline is extremely promising with more than $50 million of what we believe are good bankable loans, some already approved and others in the review process. A part of our success in loan production is attributed to our expertise with the SBA 504 and 7A programs. These programs benefit us with new loan opportunities along with a secondary source of balance sheet liquidity and the potential for significant fee income when the guaranteed portion is sold."

Total deposits of $413.152 million at June 30, 2009 were up 15.74% from deposits of $356.976 million on June 30, 2008. Deposits were up $42.055 million, or 11.33% from year-end 2008 deposits of $371.097 million. Total 2009 deposit growth reflects increases in noncore funding of $33.917 million and increases in core deposits of $8.138 million, or 3.67%. The increased brokered deposits were utilized to fund increased investment balances.

Nonperforming assets at the end of the second quarter of 2009 totaled $14.825 million, 2.93% of total assets, an increase of $7.749 million from 2008 year end balances, and down from first quarter 2009 balances of $15.252 million. Mr. George commented, "Our current level of nonperforming assets is not indicative of overall portfolio deterioration and while these balances are higher than we'd like, they are manageable considering the risk profile of our bank and Michigan's economic environment. The majority of our nonperforming assets stem from several larger credit relationships in Southeastern Michigan which we believe were impacted by the market and the regional economy. We are also on top of our overall loan delinquencies (loans past due greater than 30 days), which stands at 1.80% of total loans. While we feel comfortable with overall credit quality, the rapid deterioration in borrower collateral values that we witnessed in the credits mentioned above has caused us to take a very cautious stance in the Southeast Michigan market place and to increase our monitoring efforts. We intend to manage our nonperforming assets in order to limit carrying costs and further collateral deterioration by aggressive disposition."

Total shareholders' equity at June 30, 2009 totaled $53.939 million, compared to $40.975 million on June 30, 2008. The increase of $12.964 million includes $11 million of preferred stock which was issued in April 2009. Book value of common shareholders' equity was $12.55 per share at June 30, 2009, an increase of $2.80 per share since the recapitalization, priced at $9.75 in December 2004.

Mr. George, commenting on upcoming events, added, "Earlier this year we announced the sale of two of our Upper Peninsula branch offices, these sales will be completed in August and will result in an approximate 4% deposit premium. The sale of these branch offices will tighten up the footprint of our franchise, further reduce operating costs, and allow us to deploy capital to higher growth markets."

Tobias concluded, "We are excited about our opportunities in these troubled economic times. We have the current asset base to support profitability with a strong capital position for future growth. We will explore opportunities for FDIC assisted deposit and loan transactions to expand our markets, while staying the course with solid organic growth opportunities within our current markets. As always, our initiatives will be governed by the ultimate strategy of preserving and increasing value for our shareholders."

Mackinac Financial Corporation is a registered bank holding company formed under the Bank Holding Company Act of 1956 with assets in excess of $500 million and whose common stock is traded on the NASDAQ stock market as "MFNC." The principal subsidiary of the Corporation is mBank. Headquartered in Manistique, Michigan, mBank has 12 branch locations; eight in the Upper Peninsula, three in the Northern Lower Peninsula and one in Oakland County, Michigan. The Company's banking services include commercial lending and treasury management products and services geared toward small to mid-sized businesses, as well as a full array of personal and business deposit products and consumer loans.

Forward-Looking Statements

This release contains certain forward-looking statements. Words such as "anticipates," "believes," "estimates," "expects," "intends," "should," "will," and variations of such words and similar expressions are intended to identify forward-looking statements: as defined by the Private Securities Litigation Reform Act of 1995. These statements reflect management's current beliefs as to expected outcomes of future events and are not guarantees of future performance. These statements involve certain risks, uncertainties and assumptions that are difficult to predict with regard to timing, extent, likelihood and degree of occurrence. Therefore, actual results and outcomes may materially differ from what may be expressed or forecasted in such forward-looking statements. Factors that could cause a difference include among others: changes in the national and local economies or market conditions; changes in interest rates and banking regulations; the impact of competition from traditional or new sources; and the possibility that anticipated cost savings and revenue enhancements from mergers and acquisitions, bank consolidations, branch closings and other sources may not be fully realized at all or within specified time frames as well as other risks and uncertainties including but not limited to those detailed from time to time in filings of the Company with the Securities and Exchange Commission. These and other factors may cause decisions and actual results to differ materially from current expectations. Mackinac Financial Corporation undertakes no obligation to revise, update, or clarify forward-looking statements to reflect events or conditions after the date of this release.

             MACKINAC FINANCIAL CORPORATION AND SUBSIDIARIES
                      SELECTED FINANCIAL HIGHLIGHTS

(Dollars in thousands,
 except per share data)                  For The Period Ended
                            -----------------------------------------------
                              June 30,      December 31,      June 30,
                                2009            2008            2008
                            -------------   ------------    -------------
                             (Unaudited)                     (Unaudited)
Selected Financial
 Condition Data (at end of
 period):
Assets                      $     506,304   $    451,431    $     437,327
Loans                             372,004        370,280          362,122
Investment securities              95,620         47,490           23,230
Deposits                          413,152        371,097          356,976
Borrowings                         36,210         36,210           36,280
Shareholders' Equity               53,939         41,552           40,975

Selected Statements of
 Income Data (six months
 and year ended):
Net interest income         $       7,546   $     12,864    $       6,163
Income before taxes and
 preferred dividend                   967          2,659            2,808
Net income                            551          1,872            1,908
Income per common share -
 Basic                                .16            .55              .56
Income per common share -
 Diluted                              .16            .55              .56

Three Months Ended:
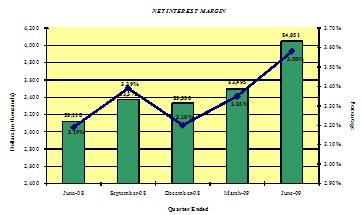
Net interest income         $       4,051   $      3,330    $       3,118
Income before taxes and
 preferred dividend                   870           (423)           2,644
Net income                            461           (252)           1,769
Income per common share -
 Basic                                .13           (.07)             .52
Income per common share -
 Diluted                              .13           (.07)             .52

Selected Financial Ratios
 and Other Data (six months
 and year ended):
Performance Ratios:
Net interest margin                  3.47 %         3.23  %          3.16 %
Efficiency ratio                    79.25          85.51            91.85
Return on average assets              .23            .44              .92
Return on average common
 equity                              2.42           4.61             9.61

Average total assets        $     473,074   $    425,343    $     417,964
Average total common
 shareholders' equity       $      45,856   $     40,630    $      39,945
Average loans to average
 deposits ratio                     95.90 %       105.61  %        107.72 %

Common Share Data (at end
 of period):
Market price per common
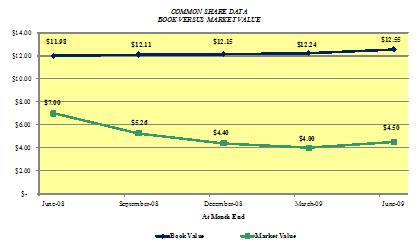
 share                      $        4.50   $       4.40    $        7.00
Book value per common share $       12.55   $      12.15    $       11.98
Common shares outstanding       3,419,736      3,419,736        3,419,736
Weighted average shares
 outstanding                    3,419,736      3,422,012        3,424,314

Other Data (at end of
 period):
Allowance for loan losses   $       4,119   $      4,277    $       3,585
Non-performing assets       $      14,825   $      7,076    $       8,008
Allowance for loan losses
 to total loans                      1.11 %         1.16  %           .99 %
Non-performing assets to
 total assets                        2.93 %         1.57  %          1.83 %
Number of:
   Branch locations                    11             12               12
   FTE Employees                      102            100               96


           MACKINAC FINANCIAL CORPORATION AND SUBSIDIARIES
                    CONSOLIDATED BALANCE SHEETS

                                    June 30,    December 31,    June 30,
(Dollars in thousands)                2008          2008          2008
                                  ------------  ------------  ------------
                                  (unaudited)                 (unaudited)
ASSETS

Cash and due from banks           $     12,189  $     10,112  $      7,115
Federal funds sold                           -             -        19,274
                                  ------------  ------------  ------------
   Cash and cash equivalents            12,189        10,112        26,389

Interest-bearing deposits in
 other financial institutions              618           582           387
Securities available for sale           95,620        47,490        23,230
Federal Home Loan Bank stock             3,794         3,794         3,794

Loans:
   Commercial                          296,392       296,088       292,645
   Mortgage                             71,777        70,447        65,869
   Installment                           3,835         3,745         3,608
                                  ------------  ------------  ------------
     Total Loans                       372,004       370,280       362,122
       Allowance for loan losses        (4,119)       (4,277)       (3,585)
                                  ------------  ------------  ------------
   Net loans                           367,885       366,003       358,537

Premises and equipment                  11,064        11,189        11,377
Other real estate held for sale          4,950         2,189         3,395
Other assets                            10,184        10,072        10,218
                                  ------------  ------------  ------------

TOTAL ASSETS                      $    506,304  $    451,431  $    437,327
                                  ============  ============  ============

LIABILITIES AND SHAREHOLDERS'
 EQUITY
LIABILITIES:
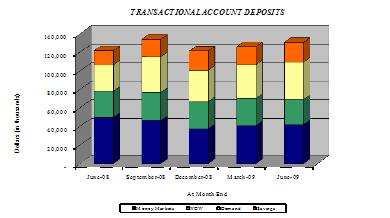
     Noninterest bearing deposits $     33,368  $     30,099  $     27,741
     NOW, money market, checking        75,974        70,584        78,703
     Savings                            21,411        20,730        15,171
     CDs < $100,000                     72,139        73,752        78,678
     CDs > $100,000                     25,455        25,044        28,252
     Brokered                          184,805       150,888       128,431
                                  ------------  ------------  ------------
       Total deposits                  413,152       371,097       356,976

   Borrowings:
     Federal funds purchased                 -             -             -
     Short-term                              -             -             -
     Long-term                          36,210        36,210        36,280
                                  ------------  ------------  ------------
       Total borrowings                 36,210        36,210        36,280
   Other liabilities                     3,003         2,572         3,096
                                  ------------  ------------  ------------
     Total liabilities                 452,365       409,879       396,352

TOTAL SHAREHOLDERS' EQUITY              53,939        41,552        40,975
                                  ------------  ------------  ------------

TOTAL LIABILITIES AND
 SHAREHOLDERS' EQUITY             $    506,304  $    451,431  $    437,327
                                  ============  ============  ============


             MACKINAC FINANCIAL CORPORATION AND SUBSIDIARIES
                CONSOLIDATED STATEMENTS OF OPERATIONS

(Dollars in thousands
 except per share data)       Three Months Ended       Six Months Ended
                                   June 30,                June 30,
                            ----------------------- -----------------------
                               2009        2008        2009        2008
                            ----------- ----------- ----------- -----------
                                  (Unaudited)             (Unaudited)
INTEREST INCOME:
     Interest and fees on
      loans:
          Taxable           $     5,104 $     5,604 $    10,106 $    11,704
          Tax-exempt                 84         102         174         210
     Interest on securities:
          Taxable                   673         271       1,132         537
          Tax-exempt                  3           2           4           3
     Other interest income           14          81          16         170
                            ----------- ----------- ----------- -----------
          Total interest
           income                 5,878       6,060      11,432      12,624
                            ----------- ----------- ----------- -----------

INTEREST EXPENSE:
     Deposits                     1,566       2,551       3,344       5,616
     Borrowings                     261         391         542         845
                            ----------- ----------- ----------- -----------
          Total interest
           expense                1,827       2,942       3,886       6,461
                            ----------- ----------- ----------- -----------

Net interest income               4,051       3,118       7,546       6,163
Provision for loan losses           150         750         700         750
                            ----------- ----------- ----------- -----------
Net interest income after
 provision for loan losses        3,901       2,368       6,846       5,413
                            ----------- ----------- ----------- -----------

OTHER INCOME:
     Service fees                   271         194         514         368
     Net security gains               -           -           -          65
     Net gains on sale of
      secondary market
      loans                          84          49         142          97
     Proceeds from lawsuit
      settlements                     -       3,475           -       3,475
     Other                           84          29         174          52
                            ----------- ----------- ----------- -----------
          Total other
           income                   439       3,747         830       4,057
                            ----------- ----------- ----------- -----------

OTHER EXPENSES:
     Salaries and employee
      benefits                    1,561       2,075       3,158       3,882
     Occupancy                      355         348         733         703
     Furniture and
      equipment                     222         190         411         368
     Data processing                224         216         444         437
     Professional service
      fees                          144          79         297         232
     Loan and deposit               512         144         773         254
     Telephone                       46          39          89          84
     Advertising                     80          60         158         120
     Other                          326         320         646         582
                            ----------- ----------- ----------- -----------
          Total other
           expenses               3,470       3,471       6,709       6,662
                            ----------- ----------- ----------- -----------

Income before provision for
 income taxes                       870       2,644         967       2,808
Provision for (benefit of)
 income taxes                       271         875         278         900
                            ----------- ----------- ----------- -----------

NET INCOME                          599       1,769         689       1,908
                            ----------- ----------- ----------- -----------

Preferred dividend expense          138           -         138           -

                            ----------- ----------- ----------- -----------
NET INCOME AVAILABLE TO
 COMMON SHAREHOLDERS        $       461 $     1,769 $       551 $     1,908
                            =========== =========== =========== ===========

INCOME PER COMMON SHARE:
     Basic                  $       .13 $       .52 $       .16 $       .56
                            =========== =========== =========== ===========
     Diluted                $       .13 $       .52 $       .16 $       .56
                            =========== =========== =========== ===========


           MACKINAC FINANCIAL CORPORATION AND SUBSIDIARIES
                   LOAN PORTFOLIO AND CREDIT QUALITY

(Dollars in thousands)

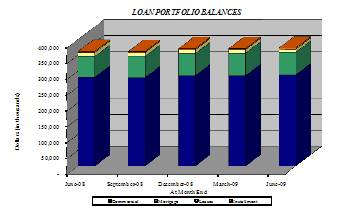
Loan Portfolio Balances (at end of period):

                                    June 30,    December 31,    June 30,
                                      2009          2008          2008
                                  ------------- ------------- -------------
Commercial Loans
Real estate - operators of
 nonresidential buildings         $      44,087 $      41,299 $      41,778
Hospitality and tourism                  35,033        35,086        35,053
Real estate agents and managers          24,614        29,292        27,495
Operators of nonresidential
 buildings                               13,525        13,467        15,238
Other                                   153,008       145,831       144,017
                                  ------------- ------------- -------------
   Total Commercial Loans               270,267       264,975       263,581

1-4 family residential real
 estate                                  65,564        65,595        60,882
Consumer                                  3,835         3,745         3,608
Construction
   Commercial                            26,125        31,113        29,064
   Consumer                               6,213         4,852         4,987
                                  ------------- ------------- -------------

   Total Loans                    $     372,004 $     370,280 $     362,122
                                  ============= ============= =============


Credit Quality (at end of period):

                              June 30,      December 31,      June 30,
                                2009            2008            2008
                            -------------   -------------   -------------
Nonperforming Assets:
Nonaccrual loans            $       9,283   $       4,887   $       4,613
Loans past due 90 days or
 more                                   -               -               -
Restructured loans                    592               -               -
                            -------------   -------------   -------------
   Total nonperforming
    loans                           9,875           4,887           4,613
Other real estate owned             4,950           2,189           3,395
                            -------------   -------------   -------------
   Total nonperforming
    assets                  $      14,825   $       7,076   $       8,008
                            =============   =============   =============
Nonperforming loans as a %
 of loans                            2.65 %          1.32 %          1.27 %
                            -------------   -------------   -------------
Nonperforming assets as a %
 of assets                           2.93 %          1.57 %          1.83 %
                            -------------   -------------   -------------
Reserve for Loan Losses:
At period end               $       4,119   $       4,277   $       3,585
                            -------------   -------------   -------------
As a % of average loans              1.11 %          1.16 %          1.00 %
                            -------------   -------------   -------------
As a % of nonperforming
 loans                              41.71 %         87.52 %         77.72 %
                            -------------   -------------   -------------
As a % of nonaccrual loans          44.37 %         87.52 %         77.72 %
                            =============   =============   =============

Charge-off Information
 (year to date):
   Average loans                  371,278         361,324         360,176
                            -------------   -------------   -------------
   Net charge-offs                    858           2,169           1,310
                            -------------   -------------   -------------
   Charge-offs as a % of
    average loans                     .23 %           .60 %           .36 %
                            -------------   -------------   -------------


          MACKINAC FINANCIAL CORPORATION AND SUBSIDIARIES
                  QUARTERLY FINANCIAL HIGHLIGHTS

                                           December   September
                     June 30,   March 31,     31,        30,     June 30,
                       2009       2009       2008       2008       2008
                     ---------  ---------  ---------  ---------  ---------
BALANCE SHEET
 (Dollars in
 thousands)

Total loans          $ 372,004  $ 370,776  $ 370,280  $ 361,521  $ 362,122
Allowance for loan
 losses                 (4,119)    (4,793)    (4,277)    (3,385)    (3,585)
                     ---------  ---------  ---------  ---------  ---------
   Total loans, net    367,885    365,983    366,003    358,136    358,537
Intangible assets            6         26         46         65         85
Total assets           506,304    466,375    451,431    440,953    437,327
Core deposits          202,892    196,860    195,165    208,940    200,293
Noncore deposits (1)   210,260    188,897    175,932    151,754    156,683
                     ---------  ---------  ---------  ---------  ---------
   Total deposits      413,152    385,757    371,097    360,694    356,976
Total borrowings        36,210     36,210     36,210     36,210     36,280
Total shareholders'
 equity                 53,939     41,864     41,552     41,427     40,975
Total shares
 outstanding         3,419,736  3,419,736  3,419,736  3,419,736  3,419,736

AVERAGE BALANCES
 (Dollars in
 thousands)

Assets               $ 491,205  $ 454,741  $ 441,583  $ 423,702  $ 418,246
Loans                  371,609    370,943    366,077    358,844    362,574
Deposits               401,510    372,670    358,213    341,377    332,725
Equity                  49,855     41,813     41,516     41,097     40,399

INCOME STATEMENT
 (Dollars in
 thousands)

Net interest income  $   4,051  $   3,495  $   3,330  $   3,371  $   3,118
Provision for loan
 losses                    150        550      1,100        450        750
                     ---------  ---------  ---------  ---------  ---------
   Net interest
    income after
    provision            3,901      2,945      2,230      2,921      2,368
Total noninterest
 income                    439        391        308        288      3,747
Total noninterest
 expense                 3,470      3,239      2,961      2,935      3,471
                     ---------  ---------  ---------  ---------  ---------
Income before taxes        870         97       (423)       274      2,644
Provision for income
 taxes                     271          7       (171)        58        875
Preferred dividend
 expense                   138          -          -          -          -
                     ---------  ---------  ---------  ---------  ---------
Net income           $     461  $      90  $    (252) $     216  $   1,769
                     =========  =========  =========  =========  =========

PER SHARE DATA

Earnings - basic     $     .13  $     .03  $    (.07) $     .06  $     .52
Earnings - diluted         .13        .03       (.07)       .06        .52
Book value per
 common share            12.55      12.24      12.15      12.11      11.98
Market value,
 closing price            4.50       4.00       4.40       5.26       7.00

ASSET QUALITY RATIOS

Nonperforming
 loans/total loans        2.65%      3.52%      1.32%      1.29%      1.27%
Nonperforming
 assets/total assets      2.93       3.27       1.57       1.45       1.83
Allowance for loan
 losses/total loans       1.11       1.29       1.16        .94        .99
Allowance for loan
 losses/nonperformi-
 ng loans                41.71      36.72      87.52      72.81      77.22

PROFITABILITY RATIOS

Return on average
 assets                    .38%       .08%      (.23)%      .20%      1.70%
Return on average
 equity                   3.71        .87      (2.42)      2.08      17.62
Net interest margin       3.58       3.35       3.20       3.39       3.19
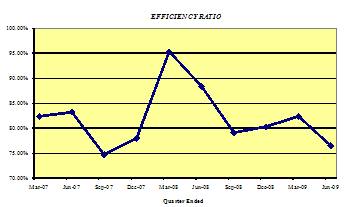
Efficiency ratio         76.55      82.36      80.30      79.12      88.45
Average
 loans/average
 deposits                92.55      99.54     102.20     105.12     108.97

CAPITAL ADEQUACY
 RATIOS

Tier 1 leverage
 ratio                    9.65%      7.86%      8.01%      8.31%      8.56%
Tier 1 capital to
 risk weighted
 assets                  11.94       9.31       9.25       9.40       9.48
Total capital to
 risk weighted
 assets                  13.00      10.56      10.38      10.31      10.45
Average
 equity/average
 assets                  10.15       9.20       9.40       9.70       9.66
Tangible
 equity/tangible
 assets                  10.65       8.97       9.20       9.38       9.35

(1)  Noncore deposits includes Internet CDs, brokered deposits and CDs
     greater than $100,000

Contact Information: Contact: Investor Relations (888) 343-8147 Website: www.bankmbank.com