MACKINAC FINANCIAL CORPORATION AND SUBSIDIARIES
SELECTED FINANCIAL HIGHLIGHTS
(Dollars in thousands, except per
share data) For The Period Ended
-------------------------------------
September 30, December 31, September 30,
2010 2009 2009
----------- ----------- -----------
(Unaudited) (Unaudited)
Selected Financial Condition Data
(at end of period):
Assets $ 499,006 $ 515,377 $ 513,180
Loans 382,727 384,310 384,100
Investment securities 37,450 46,513 80,203
Deposits 404,524 421,389 418,581
Borrowings 36,069 36,140 36,140
Shareholders' Equity 55,987 55,299 55,766
Selected Statements of Income Data
(nine months and year ended):
Net interest income $ 12,109 $ 16,287 $ 11,856
Provision for loan losses 4,700 3,700 1,400
Income (Loss) before taxes and
preferred dividend (3,103) 3,536 3,552
Net income 934 1,907 2,087
Income per common share - Basic .27 .56 .61
Income per common share - Diluted .27 .56 .61
Three Months Ended:
Net interest income $ 4,064 $ 4,431 $ 4,310
Income (Loss) before taxes and
preferred dividend 111 (16) 2,585
Net income (Loss) (104) (180) 1,536
Income (Loss) per common share -
Basic (.03) (.05) .45
Income (Loss) per common share -
Diluted (.03) (.05) .45
Weighted average shares outstanding 3,419,736 3,419,736 3,419,736
Selected Financial Ratios and Other
Data (nine months and year ended):
Performance Ratios:
Net interest margin 3.59% 3.59% 3.54%
Efficiency ratio 74.12 73.37 77.71
Return on average assets .25 .39 .57
Return on average equity 2.21 3.77 5.72
Average total assets $ 507,938 $ 493,652 $ 486,760
Average total shareholders' equity $ 56,561 $ 50,531 $ 48,801
Average loans to average deposits
ratio 93.19% 92.99% 93.22%
Common Share Data (at end of
period):
Market price per common share $ 5.10 $ 4.64 $ 4.10
Book value per common share $ 13.26 $ 13.10 $ 13.25
Common shares outstanding 3,419,736 3,419,736 3,419,736
Other Data (at end of period):
Allowance for loan losses $ 5,437 $ 5,225 $ 4,081
Non-performing assets $ 17,005 $ 21,041 $ 17,349
Allowance for loan losses to total
loans 1.42% 1.36% 1.06%
Non-performing assets to total
assets 3.41% 4.08% 3.38%
Texas Ratio* 27.68% 34.77% 28.99%
Number of:
Branch locations 11 10 10
FTE Employees 98 100 97
* Texas Ratio: Non-performing Assets divided by Total Equity plus
Allowance for Loan Losses
MACKINAC FINANCIAL CORPORATION AND SUBSIDIARIES
CONSOLIDATED BALANCE SHEETS
September 30, December 31, September 30,
(Dollars in thousands) 2010 2009 2009
----------- ----------- -----------
(Unaudited) (Unaudited)
ASSETS
Cash and due from banks $ 36,561 $ 18,433 $ 23,249
Federal funds sold 12,000 27,000 -
----------- ----------- -----------
Cash and cash equivalents 48,561 45,433 23,249
Interest-bearing deposits in other
financial institutions 692 678 662
Securities available for sale 37,450 46,513 80,203
Federal Home Loan Bank stock 3,794 3,794 3,794
Loans:
Commercial 295,262 305,670 306,590
Mortgage 82,312 74,350 73,116
Installment 5,153 4,290 4,394
----------- ----------- -----------
Total Loans 382,727 384,310 384,100
Allowance for loan losses (5,437) (5,225) (4,081)
----------- ----------- -----------
Net loans 377,290 379,085 380,019
Premises and equipment 9,843 10,165 10,281
Other real estate held for sale 5,758 5,804 5,821
Other assets 15,618 23,905 9,151
----------- ----------- -----------
TOTAL ASSETS $ 499,006 $ 515,377 $ 513,180
=========== =========== ===========
LIABILITIES AND SHAREHOLDERS' EQUITY
LIABILITIES:
Deposits:
Noninterest bearing deposits $ 44,402 $ 35,878 $ 33,254
NOW, money market, checking 127,828 95,790 88,843
Savings 20,265 18,207 18,807
CDs < $100,000 94,560 59,953 59,637
CDs > $100,000 22,809 36,385 25,409
Brokered 94,660 175,176 192,631
----------- ----------- -----------
Total deposits 404,524 421,389 418,581
Borrowings:
Federal Home Loan Bank 35,000 35,000 35,000
Other 1,069 1,140 1,140
----------- ----------- -----------
Total borrowings 36,069 36,140 36,140
Other liabilities 2,426 2,549 2,693
----------- ----------- -----------
Total liabilities 443,019 460,078 457,414
TOTAL SHAREHOLDERS' EQUITY 55,987 55,299 55,766
----------- ----------- -----------
TOTAL LIABILITIES AND SHAREHOLDERS'
EQUITY $ 499,006 $ 515,377 $ 513,180
=========== =========== ===========
MACKINAC FINANCIAL CORPORATION AND SUBSIDIARIES
CONSOLIDATED STATEMENTS OF OPERATIONS
(Dollars in thousands except per
share data) Three Months Ended Nine Months Ended
September 30, September 30,
------------------- -------------------
2010 2009 2010 2009
-------- --------- -------- ---------
(Unaudited) (Unaudited)
INTEREST INCOME:
Interest and fees on loans:
Taxable $ 5,300 $ 5,106 $ 15,718 $ 15,212
Tax-exempt 46 63 145 237
Interest on securities:
Taxable 324 888 1,077 2,020
Tax-exempt 7 7 21 11
Other interest income 23 28 100 44
-------- --------- -------- ---------
Total interest income 5,700 6,092 17,061 17,524
-------- --------- -------- ---------
INTEREST EXPENSE:
Deposits 1,414 1,550 4,309 4,894
Borrowings 222 232 643 774
-------- --------- -------- ---------
Total interest expense 1,636 1,782 4,952 5,668
-------- --------- -------- ---------
Net interest income 4,064 4,310 12,109 11,856
Provision for loan losses 1,000 700 4,700 1,400
-------- --------- -------- ---------
Net interest income after provision
for loan losses 3,064 3,610 7,409 10,456
-------- --------- -------- ---------
OTHER INCOME:
Service fees 264 235 737 750
Net security gains (1) 644 215 644
Net gains on sale of secondary
market loans 322 247 897 389
Other 63 1,292 199 1,465
-------- --------- -------- ---------
Total other income 648 2,418 2,048 3,248
-------- --------- -------- ---------
OTHER EXPENSES:
Salaries and employee benefits 1,779 1,603 5,281 4,761
Occupancy 358 336 1,048 1,069
Furniture and equipment 202 193 593 604
Data processing 193 221 587 665
Professional service fees 168 161 502 458
Loan and deposit 441 402 3,297 1,175
Telephone 53 50 145 139
Advertising 77 80 220 238
Other 330 397 887 1,043
-------- --------- -------- ---------
Total other expenses 3,601 3,443 12,560 10,152
-------- --------- -------- ---------
Income (Loss) before provision for
income taxes 111 2,585 (3,103) 3,552
Provision for (benefit of) income
taxes 30 864 (4,593) 1,142
-------- --------- -------- ---------
NET INCOME (LOSS) 81 1,721 1,490 2,410
-------- --------- -------- ---------
Preferred dividend expense 185 185 556 323
-------- --------- -------- ---------
NET INCOME (LOSS) AVAILABLE TO
COMMON SHAREHOLDERS $ (104) $ 1,536 $ 934 $ 2,087
======== ========= ======== =========
INCOME (LOSS) PER COMMON SHARE:
Basic $ (0.03) $ .45 $ .27 $ .61
======== ========= ======== =========
Diluted $ (0.03) $ .45 $ .27 $ .61
======== ========= ======== =========
MACKINAC FINANCIAL CORPORATION AND SUBSIDIARIES
LOAN PORTFOLIO AND CREDIT QUALITY
(Dollars in thousands)
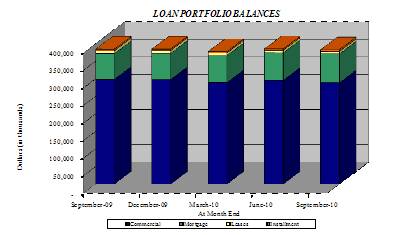
Loan Portfolio Balances (at end of period):
September 30, December 31, September 30,
2010 2009 2009
------------ ------------ ------------
Commercial Loans
Real estate - operators of
nonresidential buildings $ 52,192 $ 48,689 $ 47,007
Hospitality and tourism 39,998 45,315 45,867
Commercial construction 25,718 24,591 24,076
Real estate agents and managers 19,675 24,242 23,996
Other 157,679 162,833 165,644
------------ ------------ ------------
Total Commercial Loans 295,262 305,670 306,590
1-4 family residential real estate
and construction 82,312 74,350 73,116
Consumer 5,153 4,290 4,394
------------ ------------ ------------
Total Loans $ 382,727 $ 384,310 $ 384,100
============ ============ ============
Credit Quality (at end of period):
September 30, December 31, September 30,
2010 2009 2009
----------- ----------- -----------
Nonperforming Assets :
Nonaccrual loans $ 4,447 $ 14,368 $ 10,655
Loans past due 90 days or more - - -
Restructured loans 6,800 869 873
----------- ----------- -----------
Total nonperforming loans 11,247 15,237 11,528
Other real estate owned 5,758 5,804 5,821
----------- ----------- -----------
Total nonperforming assets $ 17,005 $ 21,041 $ 17,349
=========== =========== ===========
Nonperforming loans as a % of loans 2.94% 3.96% 3.00%
----------- ----------- -----------
Nonperforming assets as a % of
assets 3.41% 4.08% 3.38%
----------- ----------- -----------
Reserve for Loan Losses:
At period end $ 5,437 $ 5,225 $ 4,081
----------- ----------- -----------
As a % of average loans 1.42% 1.39% 1.10%
----------- ----------- -----------
As a % of nonperforming loans 48.34% 34.29% 35.40%
----------- ----------- -----------
As a % of nonaccrual loans 122.26% 36.37% 38.30%
=========== =========== ===========
Charge-off Information (year to
date):
Average loans $ 384,028 $ 374,796 $ 370,952
----------- ----------- -----------
Net charge-offs $ 4,488 $ 2,752 $ 1,596
----------- ----------- -----------
Charge-offs as a % of average
loans 1.17% .73% .43%
----------- ----------- -----------
MACKINAC FINANCIAL CORPORATION AND SUBSIDIARIES
QUARTERLY FINANCIAL HIGHLIGHTS
QUARTER ENDED
----------------------------------------------------------
(Unaudited)
----------------------------------------------------------
September December September
30, June 30, March 31, 31, 30,
2010 2010 2010 2009 2009
--------- --------- ---------- --------- ----------
BALANCE SHEET
(Dollars in
thousands)
Total loans $ 382,727 $ 384,839 $ 377,311 $ 384,310 $ 384,100
Allowance for
loan losses (5,437) (6,371) (4,737) (5,225) (4,081)
--------- --------- ---------- --------- ----------
Total loans,
net 377,290 378,468 372,574 379,085 380,019
Intangible
assets - - - - -
Total assets 499,006 500,774 502,427 515,377 513,180
Core deposits 287,055 271,026 236,227 209,828 200,541
Noncore
deposits (1) 117,469 134,758 168,985 211,561 218,040
--------- --------- ---------- --------- ----------
Total
deposits 404,524 405,784 405,212 421,389 418,581
Total borrowings 36,069 36,140 36,140 36,140 36,140
Total
shareholders'
equity 55,987 56,231 58,722 55,299 55,766
Total shares
outstanding 3,419,736 3,419,736 3,419,736 3,419,736 3,419,736
AVERAGE BALANCES
(Dollars in thousands)
Assets $ 512,335 $ 502,942 $ 508,495 $ 514,102 $ 513,687
Loans 385,268 382,169 384,640 386,203 370,310
Deposits 416,847 405,449 413,897 418,280 419,102
Equity 56,668 57,889 55,109 55,665 54,594
INCOME STATEMENT
(Dollars in
thousands)
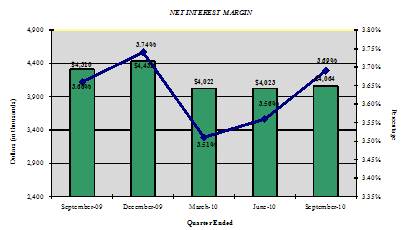
Net interest
income $ 4,064 $ 4,023 $ 4,022 $ 4,431 $ 4,310
Provision for
loan losses 1,000 2,800 900 2,300 700
--------- --------- ---------- --------- ----------
Net interest
income after
provision 3,064 1,223 3,122 2,131 3,610
Total noninterest
income 648 593 807 1,503 2,418
Total noninterest
expense 3,601 5,330 3,629 3,650 3,443
--------- --------- ---------- --------- ----------
Income (Loss)
before taxes 111 (3,514) 300 (16) 2,585
Provision for
(benefit of)
income taxes 30 (1,212) (3,411) (22) 864
Preferred
dividend
expense 185 186 185 186 185
--------- --------- ---------- --------- ----------
Net income (loss)
available to
common
shareholders $ (104) $ (2,488) $ 3,526 $ (180) $ 1,536
========= ========= ========== ========= ==========
PER SHARE DATA
Earnings
(Losses) -
basic $ (.03) $ (.73) $ 1.03 $ (.05) $ .45
Earnings
(Losses)-
diluted (.03) (.73) 1.03 (.05) .45
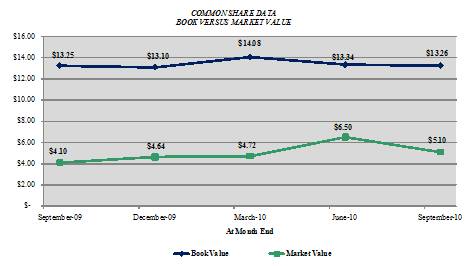
Book value per
common share 13.26 13.34 14.08 13.10 13.25
Market value,
closing price 5.10 6.50 4.72 4.64 4.10
ASSET QUALITY RATIOS
Nonperforming
loans/total
loans 2.94% 2.87% 2.62% 3.96% 3.00%
Nonperforming
assets/total
assets 3.41 3.34 3.51 4.08 3.38
Allowance for
loan
losses/total
loans 1.42 1.66 1.26 1.36 1.06
Allowance for
loan losses/
nonperforming
loans 48.34 57.69 47.87 34.29 35.40
Texas Ratio(2) 27.68 26.71 27.76 34.77 28.99
PROFITABILITY RATIOS
Return on
average assets (.08)% (1.98)% 2.81% (.14)% 1.19%
Return on
average equity (0.73) (17.24) 25.95 (1.28) 11.16
Net interest
margin 3.69 3.56 3.51 3.74 3.66
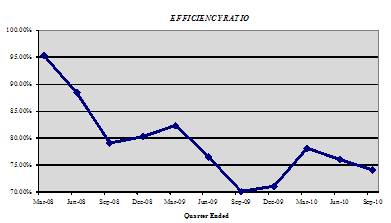
Efficiency ratio 75.98 76.04 78.12 71.03 70.09
Average
loans/average
deposits 92.42 94.26 92.93 92.33 88.36
CAPITAL ADEQUACY
RATIOS
Tier 1 leverage
ratio 9.22% 9.38% 9.85% 9.75% 9.74%
Tier 1 capital
to risk weighted
assets 11.73 11.65 12.48 11.92 12.18
Total capital
to risk weighted
assets 12.98 12.91 13.69 13.17 13.19
Average equity/
average assets 11.06 11.51 10.84 10.83 10.63
Tangible equity/
tangible assets 11.06 11.51 10.84 10.83 10.87
(1) Noncore deposits includes Internet CDs, brokered deposits and
CDs greater than $100,000
(2) Texas Ratio: Nonperforming Assets divided by Total Equity plus
Allowance for Loan Losses
Contact Information: Contact: Investor Relations (888) 343-8147 Website: www.bankmbank.com