- Record Total Revenue
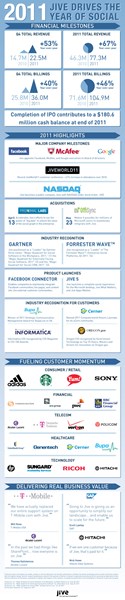
- 4Q total revenue of $22.5 million, up 53% year-over-year
- 2011 total revenue of $77.3 million, up 67% year-over-year
- Record Billings
- 4Q total billings of $36.0 million, up 40% year-over-year
- 2011 total billings of $104.9 million, up 46% year-over-year
- Completion of IPO contributes to a $180.6 million cash balance at end of 2011
PALO ALTO, Calif., Feb. 7, 2012 (GLOBE NEWSWIRE) -- Jive Software, Inc. (Nasdaq:JIVE), today announced financial results for its fourth quarter and full year ended December 31, 2011.
A photo accompanying this release is available at http://www.globenewswire.com/newsroom/prs/?pkgid=11591
"We are thrilled to announce record financial results for the quarter, which represented a strong finish to a remarkable year," stated Tony Zingale, Chairman & CEO of Jive. "Jive is increasingly being adopted by large global organizations that are investing in social business to change the way work gets done. During the fourth quarter, we had a record number of wins with an annual subscription value of $1 million or greater, and more than doubled the average annual deal size for new relationships during 2011."
Zingale added, "The completion of Jive's IPO was a milestone event for us as we became the first publicly traded social business software pure play. Jive is well-positioned to execute on our growth strategy and capitalize on our leadership position in this rapidly growing, multi-billion dollar market."
Fourth Quarter 2011 Financial Highlights
-
Revenue: Total revenue for the fourth quarter was $22.5 million, an increase of 53% on a year-over-year basis. Within total revenue, product revenue was $19.2 million for the fourth quarter, an increase of 61% on a year-over-year basis. Professional Services revenue for the fourth quarter was $3.3 million, an increase of 21% on a year-over-year basis.
-
Non-GAAP Billings: Total billings, which the company defines as revenue plus the change in total deferred revenue, were $36.0 million for the fourth quarter, an increase of 40% on a year-over-year basis.
-
Gross Profit: GAAP gross profit for the fourth quarter was $12.6 million, compared to $8.5 million for the fourth quarter of 2010. Non-GAAP gross profit was $13.5 million for the fourth quarter, representing a year-over-year increase of 57% and a non-GAAP gross margin of 60%.
-
Loss from Operations: GAAP loss from operations for the fourth quarter was $11.9 million,compared to a loss of $6.4 million for the fourth quarter of 2010. Non-GAAP loss from operations was $8.3 million, compared to a loss of $5.6 million for the fourth quarter of 2010.
- Net Loss: GAAP net loss for the fourth quarter was $12.7 million, compared to a net loss of $6.8 million for the same period last year. GAAP net loss per share for the fourth quarter was $0.39 based on 32.5 million weighted-average shares outstanding, compared to a loss per share of $0.30 based on 22.7 million weighted-average shares outstanding for the same period last year.
Non-GAAP net loss for the fourth quarter was $9.1 million, compared to a net loss of $5.7 million for the same period last year. Non-GAAP net loss per share for the fourth quarter was $0.28 based on 32.5 million weighted-average shares outstanding, compared to net a loss per share of $0.25 based on 22.7 million weighted-average shares outstanding for the same period last year.
-
Balance Sheet and Cash Flow: As of December 31, 2011, Jive had cash and cash equivalents of $180.6 million, an increase from $72.6 million at the end of the third quarter. The increase in cash was due to the company's initial public offering, which priced on December 12, 2011 and generated net proceeds of $131.4 million. The company used $19.9 million of the net proceeds to pay down outstanding debt.
The company used $2.4 million in cash from operations and invested $4.0 million in capital expenditures, leading to free cash flow of ($6.4) million for the fourth quarter. Free cash flow was ($0.1) million for the fourth quarter of 2010.
A reconciliation of GAAP to non-GAAP financial measures has been provided in the financial statement tables included in this press release. An explanation of these measures is also included below under the heading "Non-GAAP Financial Measures."
Fourth Quarter and Recent Business Highlights
-
Signed new and expanded customer relationships including ACE Group, PricewaterhouseCoopers LLP/UK, SAP and Thomson Reuters among others;
-
Successful initial public offering raised $131.4 million in net proceeds through the sale of 12,088,403 shares of Jive's common stock;
-
Hosted over 1,000 customers and partners at JiveWorld11, the industry leading social business customer event. Attendance was at a record level and increased over 60% from last year's event;
-
Expanded relationships with leading global system integrators Accenture, CapGemini and Hewlett-Packard;
- Continued to aggressively expand the capabilities of the market leading Jive 5 platform, including new releases of HTML 5-based Jive Mobile, Jive Connect for Outlook and Jive Fathom, Jive's fully integrated social media monitoring solution.
Full Year 2011 Financial Highlights
-
Revenue: Total revenue was $77.3 million for fiscal 2011, an increase of 67% on a year-over-year basis. Within total revenue, product revenue was $65.3 million for fiscal 2011, an increase of 73% on a year-over-year basis. Professional Services revenue for fiscal 2011 was $12.0 million, an increase of 42% on a year-over-year basis.
-
Non-GAAP Billings: Total billings, which the company defines as revenue plus the change in total deferred revenue, were $104.9 million for fiscal 2011, an increase of 46% on a year-over-year basis.
-
Gross Profit: GAAP gross profit was $43.0 million for fiscal 2011, compared to $26.6 million for fiscal 2010. Non-GAAP gross profit was $45.3 million for fiscal 2011, representing a year-over-year increase of 68% and a non-GAAP gross margin of 59%.
-
Loss from Operations: GAAP loss from operations was $45.7 million for fiscal 2011, compared to a loss of $27.1 million for fiscal 2010. Non-GAAP loss from operations was $32.2 million for fiscal 2011, compared to a loss of $23.4 million for fiscal 2010.
- Net Loss: GAAP net loss for fiscal 2011 was $50.8 million, compared to a $27.6 million net loss for fiscal 2010. GAAP net loss per share for fiscal 2011 was $1.95 based on 26.1 million weighted-average shares outstanding, compared to a loss per share of $1.25 based on 22.1 million weighted-average shares outstanding for fiscal 2010.
Non-GAAP net loss for fiscal 2011 was $33.9 million, compared to a $23.7 million net loss for fiscal 2010. Non-GAAP net loss per share for fiscal 2011 was $1.30, based on 26.1 million weighted-average shares outstanding, compared to a loss per share of $1.07 based on 22.1 million weighted-average shares outstanding for fiscal 2010.
- Cash Flow: The company used $9.5 million in cash from operations and invested $9.8 million in capital expenditures, leading to free cash flow of ($19.3) million for fiscal 2011. Free cash flow was ($12.0) million for fiscal 2010.
A reconciliation of GAAP to non-GAAP financial measures has been provided in the financial statement tables included in this press release. An explanation of these measures is also included below under the heading "Non-GAAP Financial Measures."
Financial Outlook
As of February 7, 2012, Jive is initiating guidance for its first quarter and full year 2012 as follows:
-
First Quarter 2012 Guidance: Total revenue is expected to be in the range of $23.5 million to $24.5 million. Non-GAAP loss from operations is expected to be in the range of $7.0 million to $7.5 million. Non-GAAP loss per share is expected to be in the range of $0.13 to $0.14 based on approximately 61.4 million weighted-average diluted shares outstanding.
- Full Year 2012 Guidance: Total revenue is expected to be in the range of $108.0 million to $112.0 million. Non-GAAP loss from operations is expected to be in the range of $23.0 million to $25.0 million. Non-GAAP loss per share is expected to be in the range of $0.40 to $0.45 based on approximately 61.7 million weighted-average diluted shares outstanding. Free cash flow is expected to be in the range of ($5.0) million to ($7.0) million.
With respect to the Company's expectations under "Financial Outlook" above, the Company has not reconciled non-GAAP loss from operations or non-GAAP loss per share to GAAP loss from operations and GAAP loss per share because the Company does not provide guidance for stock-based compensation, income taxes or amortization of intangible assets, which are reconciling items between those Non-GAAP and GAAP measures. As items that impact loss from operations and loss per share are out of the Company's control and/or cannot be reasonably predicted, the Company is unable to provide such guidance. Accordingly, a reconciliation to loss from operations and loss per share is not available without unreasonable effort.
Quarterly Conference Call
Jive will host a conference call today at 2:00 p.m. PT (5:00 p.m. ET) to review the Company's financial results for the fourth quarter and full year 2011, in addition to discussing the company's outlook for the first quarter and full year 2012. To access this call, dial (877) 545-1415 (domestic) or (719) 785-9448 (international) with conference ID #2117974. A live webcast of the conference call will be accessible from the Investor Relations section of Jive's website at http://investors.jivesoftware.com/ and a replay will be archived and accessible at: http://investors.jivesoftware.com/events.cfm. A replay of this conference call can also be accessed through February 21, 2012, by dialing (877) 870-5176 (domestic) or (858) 384-5517 (international). The replay passcode is 2117974.
About Jive Software
Jive Software (Nasdaq:JIVE) is a leading global Social Business company. We bring social technology innovations from the consumer world into enterprises securely and at scale, changing the way work gets done. Our platform combines the power of big data, enterprise integrations and social collaboration technologies. Millions of people at the world's largest companies are using Jive-powered communities internally and externally to transform their businesses.
Non-GAAP Financial Measures
The Company uses certain non-GAAP financial measures in this release. Generally, a non-GAAP financial measure is a numerical measure of a company's performance, financial position or cash flows that either excludes or includes amounts that are not normally excluded or included in the most directly comparable measure calculated and presented in accordance with generally accepted accounting principles.
Non-GAAP operating loss, net loss and net loss per share exclude stock-based compensation expenses, non-recurring expenses related to acquisitions, amortization of acquisition related intangible assets, and changes in fair value of warrant liabilities. Total billings is defined by the company as revenue plus the change in total deferred revenue. Management presents these non-GAAP financial measures because it considers them to be important supplemental measures of performance. Management uses the non-GAAP financial measures for planning purposes, including analysis of the Company's performance against prior periods, the preparation of operating budgets and to determine appropriate levels of operating and capital investments. Management also believes that the non-GAAP financial measures provide additional insight for analysts and investors in evaluating the Company's financial and operational performance. However, these non-GAAP financial measures have limitations as an analytical tool and are not intended to be an alternative to financial measures prepared in accordance with GAAP. We intend to provide these non-GAAP financial measures as part of our future earnings discussions and, therefore, the inclusion of these non-GAAP financial measures will provide consistency in our financial reporting. A reconciliation of these non-GAAP measures to GAAP is provided in the accompanying tables.
Safe Harbor Statement
"Safe Harbor" statement under Private Securities Litigation Reform Act of 1995: This press release contains forward-looking statements, including statements concerning our financial guidance for the first fiscal quarter of 2012 and the full year of 2012, our position to execute on our growth strategy, and our ability to capitalize on our leadership position in the social business market. The achievement of success of the matters covered by such forward-looking statements involve substantial risks, uncertainties and assumptions. If any such risks or uncertainties materialize or if any of the assumptions prove incorrect, our results or events could differ materially from the results expressed or implied by the forward-looking statements we make.
The risk and uncertainties referred to above include, but are not limited to, risks associated with our limited operating history; expectations regarding the widespread adoption of social business software by enterprises; uncertainty regarding the market for social business software; changes in the competitive dynamics of our market, our ability to increase and predict new subscription, subscription renewal or upsell rates and the impact these rates may have on our future revenues; our reliance on third-party service providers to host some of our products; the risk that our security measures could be breached and unauthorized access to customer data could be obtained; potential third party intellectual property infringement claims; and the price volatility of our common stock.
More information about potential factors that could affect our business and financial results is contained in our prospectus as filed with the Securities and Exchange Commission. Additional information will also be set forth in our quarterly reports on Form 10-Q, annual reports on Form 10-K and other filings that we make with the Securities and Exchange Commission. We do not intend and undertake no duty to release publicly any updates or revisions to any forward-looking statements contained herein.
The photo is also available at Newscom, www.newscom.com, and via AP PhotoExpress.
| JIVE SOFTWARE, INC. | ||||
| CONSOLIDATED STATEMENTS OF OPERATIONS | ||||
| (In thousands, except per share data) | ||||
| (Unaudited) | ||||
| Quarter Ended December 31, | Year Ended December 31, | |||
| 2011 | 2010 | 2011 | 2010 | |
| Revenues: | ||||
| Product | $ 19,173 | $ 11,903 | $ 65,265 | $ 37,827 |
| Professional services | 3,341 | 2,769 | 12,020 | 8,441 |
| Total revenues | 22,514 | 14,672 | 77,285 | 46,268 |
| Cost of revenues: | ||||
| Product | 6,481 | 3,226 | 21,689 | 9,870 |
| Professional services | 3,450 | 2,959 | 12,596 | 9,836 |
| Total cost of revenues | 9,931 | 6,185 | 34,285 | 19,706 |
| Gross profit | 12,583 | 8,487 | 43,000 | 26,562 |
| Operating expenses: | ||||
| Research and development | 7,775 | 5,401 | 31,095 | 18,278 |
| Sales and marketing | 13,037 | 8,082 | 44,794 | 28,592 |
| General and administrative | 3,675 | 1,448 | 12,795 | 6,746 |
| Total operating expenses | 24,487 | 14,931 | 88,684 | 53,616 |
| Loss from operations | (11,904) | (6,444) | (45,684) | (27,054) |
| Other income (expense), net: | ||||
| Interest income | 4 | 23 | 40 | 82 |
| Interest expense | (812) | (85) | (1,735) | (264) |
| Change in fair value of warrant liability | -- | (188) | (7,185) | (222) |
| Other, net | (7) | (44) | (3) | (91) |
| Total other income (expense), net | (815) | (294) | (8,883) | (495) |
| Loss before provision for (benefit from) income taxes | (12,719) | (6,738) | (54,567) | (27,549) |
| Provision for (benefit from) income taxes | (53) | 27 | (3,763) | 91 |
| Net loss | $ (12,666) | $ (6,765) | $ (50,804) | $ (27,640) |
| Basic and diluted net loss per share | $ (0.39) | $ (0.30) | $ (1.95) | $ (1.25) |
| Shares used in basic and diluted per share calculations | 32,490 | 22,745 | 26,071 | 22,096 |
| JIVE SOFTWARE, INC. | ||
| CONSOLIDATED BALANCE SHEETS | ||
| (In thousands, except share and per share data) | ||
| (Unaudited) | ||
| December 31, | ||
| 2011 | 2010 | |
| Assets | ||
| Current assets: | ||
| Cash and cash equivalents | $ 180,649 | $ 43,348 |
| Accounts receivable, net | 31,999 | 20,344 |
| Prepaid expenses and other current assets | 4,503 | 3,031 |
| Total current assets | 217,151 | 66,723 |
| Property and equipment, net | 12,639 | 6,771 |
| Goodwill | 17,265 | 831 |
| Intangible assets, net | 11,141 | 2,807 |
| Other assets | 146 | 408 |
| Total assets | $ 258,342 | $ 77,540 |
| Liabilities, Redeemable Convertible Preferred Stock and Stockholders' Equity (Deficit) | ||
| Current liabilities: | ||
| Accounts payable | $ 4,566 | $ 2,458 |
| Accrued payroll and related liabilities | 6,629 | 3,706 |
| Accrued sales and use tax | 1,268 | 923 |
| Other accrued liabilities | 3,856 | 2,944 |
| Deferred revenue, current | 62,329 | 37,034 |
| Warrants on preferred stock | -- | 264 |
| Revolving credit facility | -- | 3,533 |
| Term debt, current | 2,946 | 1,806 |
| Total current liabilities | 81,594 | 52,668 |
| Deferred revenue, less current portion | 15,497 | 13,161 |
| Term debt, less current portion | 10,192 | 3,909 |
| Other long-term liabilities | 340 | 276 |
| Total liabilities | 107,623 | 70,014 |
| Redeemable and convertible preferred stock: | ||
| Series A preferred stock, $0.0001 par value, liquidation preference $0 and $15.4 million. Authorized 10,100,000 shares; issued and outstanding 0 and 10,100,000 shares at December 31, 2011 and 2010 | -- | 15,381 |
| Series B preferred stock, $0.0001 par value, liquidation preference $0 and $12.3 million. Authorized 3,335,817 shares; issued and outstanding 0 and 3,335,817 shares at December 31, 2011 and 2010 | -- | 12,252 |
| Series C preferred stock, $0.0001 par value, liquidation preference $0 and $30.0 million. Authorized 9,646,550 shares; issued and outstanding 0 and 5,787,930 shares at December 31, 2011 and 2010 | -- | 29,928 |
| -- | 57,561 | |
| Commitments and contingencies | ||
| Stockholders' equity (deficit): | ||
| Common stock, $0.0001 par value. Authorized - 290,000,000 shares; issued - 68,568,778 shares at December 31, 2011 and 29,525,886 shares at December 31, 2010; outstanding - 61,308,006 at December 31, 2011 and 22,881,335 at December 31, 2010 | 7 | 3 |
| Less treasury stock at cost | (3,352) | (3,352) |
| Additional paid-in capital | 258,779 | 7,216 |
| Accumulated deficit | (104,725) | (53,921) |
| Accumulated other comprehensive income | 10 | 19 |
| Total stockholders' equity (deficit) | 150,719 | (50,035) |
| Total liabilities, redeemable and convertible preferred stock and stockholders' equity (deficit) | $ 258,342 | $ 77,540 |
| JIVE SOFTWARE, INC. | ||||
| CONSOLIDATED STATEMENTS OF CASH FLOWS | ||||
| (In thousands) | ||||
| (Unaudited) | ||||
| Quarter Ended December 31, | Year Ended December 31, | |||
| 2011 | 2010 | 2011 | 2010 | |
| Cash flows from operating activities: | ||||
| Net loss | $ (12,666) | $ (6,765) | $ (50,804) | $ (27,640) |
| Adjustments to reconcile net loss to net cash provided by (used in) operating activities: | ||||
| Depreciation and amortization | 2,104 | 602 | 7,211 | 1,678 |
| Stock-based compensation | 2,898 | 794 | 10,422 | 3,404 |
| Change in fair value of warrant liability | -- | 189 | 7,185 | 222 |
| Change in deferred taxes | -- | -- | (3,851) | -- |
| Gain on sale of property and equipment | (2) | -- | (2) | -- |
| (Increase) decrease, net of acquisitions, in: | ||||
| Accounts receivable, net | (7,219) | (2,943) | (11,655) | (11,987) |
| Prepaid expenses and other assets | (271) | (331) | (844) | (1,765) |
| Increase (decrease), net of acquisitions, in: | ||||
| Accounts payable | (1,588) | (1,519) | 1,682 | (1,551) |
| Accrued payroll and related liabilities | 1,721 | 739 | 2,857 | 2,260 |
| Other accrued liabilities | (934) | (227) | 623 | 2,520 |
| Deferred revenue | 13,522 | 11,332 | 27,606 | 25,578 |
| Other long-term liabilities | -- | 27 | 64 | 52 |
| Net cash provided by (used in) operating activities | (2,435) | 1,898 | (9,506) | (7,229) |
| Cash flows from investing activities: | ||||
| Payments for purchase of property and equipment | (3,977) | (2,036) | (9,814) | (4,782) |
| Increase in restricted cash | (132) | -- | (132) | -- |
| Payments for purchase of intangible assets | -- | -- | -- | (2,150) |
| Acquisitions, net of cash acquired | -- | -- | (22,892) | (650) |
| Net cash used in investing activities | (4,109) | (2,036) | (32,838) | (7,582) |
| Cash flows from financing activities: | ||||
| Proceeds from exercise of stock options and restricted stock | 1,409 | 136 | 3,416 | 985 |
| Proceeds from initial public offering, net | 133,050 | -- | 132,486 | -- |
| Proceeds from issuance of preferred stock, net | -- | (12) | 40,000 | 29,928 |
| Proceeds from issuance of warrants on preferred stock | -- | -- | -- | 42 |
| Proceeds from revolving credit facility, net | (4,048) | -- | (3,533) | 2,000 |
| Proceeds from term loans | -- | 2,724 | 24,203 | 4,340 |
| Repayments of term loans | (15,823) | (566) | (16,927) | (1,214) |
| Net cash provided by financing activities | 114,588 | 2,282 | 179,645 | 36,081 |
| Net increase in cash and cash equivalents | 108,044 | 2,144 | 137,301 | 21,270 |
| Cash and cash equivalents, beginning of period | 72,605 | 41,204 | 43,348 | 22,078 |
| Cash and cash equivalents, end of period | $180,649 | $ 43,348 | $ 180,649 | $ 43,348 |
| JIVE SOFTWARE, INC. | ||||||
| RECONCILIATION OF NON-GAAP INFORMATION | ||||||
| (In thousands, except per share data) | ||||||
| (Unaudited) | ||||||
| Quarter Ended December 31, | Year Ended December 31, | |||||
| 2011 | 2010 | 2011 | 2010 | |||
| Gross profit, as reported | $ 12,583 | $ 8,487 | $ 43,000 | $ 26,562 | ||
| Add back: | ||||||
| Stock-based compensation | 234 | 53 | 544 | 158 | ||
| Amortization related to acquisitions | 664 | 66 | 1,738 | 264 | ||
| Gross profit, non-GAAP | $ 13,481 | $ 8,606 | $ 45,282 | $ 26,984 | ||
| Quarter Ended December 31, | Year Ended December 31, | |||||
| 2011 | 2010 | 2011 | 2010 | |||
| Research and development, as reported | $ 7,775 | $ 5,401 | $ 31,095 | $ 18,278 | ||
| less: | ||||||
| Stock-based compensation | 880 | 203 | 2,644 | 528 | ||
| Amortization related to acquisitions | -- | -- | 1,031 | 3 | ||
| Non-recurring acquisition expense | -- | -- | 333 | -- | ||
| Research and development, non-GAAP | $ 6,895 | $ 5,198 | $ 27,087 | $ 17,747 | ||
| Quarter Ended December 31, | Year Ended December 31, | |||||
| 2011 | 2010 | 2011 | 2010 | |||
| Sales and marketing, as reported | $ 13,037 | $ 8,082 | $ 44,794 | $ 28,592 | ||
| less: | ||||||
| Stock-based compensation | 683 | 278 | 3,918 | 822 | ||
| Sales and marketing, non-GAAP | $ 12,354 | $ 7,804 | $ 40,876 | $ 27,770 | ||
| Quarter Ended December 31, | Year Ended December 31, | |||||
| 2011 | 2010 | 2011 | 2010 | |||
| General and administrative, as reported | $ 3,675 | $ 1,448 | $ 12,795 | $ 6,746 | ||
| less: | ||||||
| Stock-based compensation | 1,101 | 260 | 3,316 | 1,896 | ||
| General and administrative, non-GAAP | $ 2,574 | $ 1,188 | $ 9,479 | $ 4,850 | ||
| Quarter Ended December 31, | Year Ended December 31, | |||||
| 2011 | 2010 | 2011 | 2010 | |||
| Loss from operations, as reported | $ (11,904) | $ (6,444) | $ (45,684) | $ (27,054) | ||
| Add back: | ||||||
| Stock-based compensation | 2,898 | 794 | 10,422 | 3,404 | ||
| Amortization related to acquisitions | 664 | 66 | 2,769 | 267 | ||
| Non-recurring acquisition expense | -- | -- | 333 | -- | ||
| Loss from operations, non-GAAP | $ (8,342) | $ (5,584) | $ (32,160) | $ (23,383) | ||
| Quarter Ended December 31, | Year Ended December 31, | |||||
| 2011 | 2010 | 2011 | 2010 | |||
| Loss before provision for (benefit from) income taxes, as reported | $ (12,719) | $ (6,738) | $ (54,567) | $ (27,549) | ||
| Add back: | ||||||
| Stock-based compensation | 2,898 | 794 | 10,422 | 3,404 | ||
| Amortization related to acquisitions | 664 | 66 | 2,769 | 267 | ||
| Non-recurring acquisition expense | -- | -- | 333 | -- | ||
| Change in fair value of warrant liability | -- | 189 | 7,185 | 222 | ||
| Loss before provision for (benefit from) income taxes, non-GAAP | $ (9,157) | $ (5,689) | $ (33,858) | $ (23,656) | ||
| Quarter Ended December 31, | Year Ended December 31, | |||||
| 2011 | 2010 | 2011 | 2010 | |||
| Net loss, as reported | $ (12,666) | $ (6,765) | $ (50,804) | $ (27,640) | ||
| Add back: | ||||||
| Stock-based compensation | 2,898 | 794 | 10,422 | 3,404 | ||
| Amortization related to acquisitions | 664 | 66 | 2,769 | 267 | ||
| Non-recurring acquisition expense | -- | -- | 333 | -- | ||
| Change in fair value of warrant liability | -- | 189 | 7,185 | 222 | ||
| Tax benefit related to acquisition of OffiSync | -- | -- | (3,851) | -- | ||
| Net loss, non-GAAP | $ (9,104) | $ (5,716) | $ (33,946) | $ (23,747) | ||
| Quarter Ended December 31, | Year Ended December 31, | |||||
| 2011 | 2010 | 2011 | 2010 | |||
| Basic and diluted net loss per share, as reported | $ (0.39) | $ (0.30) | $ (1.95) | $ (1.25) | ||
| Add back: | ||||||
| Stock-based compensation | 0.09 | 0.03 | 0.40 | 0.15 | ||
| Amortization related to acquisitions | 0.02 | 0.00 | 0.11 | 0.01 | ||
| Non-recurring acquisition expense | 0.00 | 0.00 | 0.01 | 0.00 | ||
| Change in fair value of warrant liability | 0.00 | 0.01 | 0.28 | 0.01 | ||
| Tax benefit related to acquisition of OffiSync | 0.00 | 0.00 | (0.15) | 0.00 | ||
| Basic and diluted net loss per share, non-GAAP | $ (0.28) | $ (0.25) | $ (1.30) | $ (1.07) | ||
| Quarter Ended December 31, | Year Ended December 31, | |||||
| 2011 | 2010 | 2011 | 2010 | |||
| Total revenues | $ 22,514 | $ 14,672 | $ 77,285 | $ 46,268 | ||
| Deferred revenue, end of period | 77,826 | 50,195 | 77,826 | 50,195 | ||
| Less: Deferred revenue, beginning of period | (64,304) | (39,035) | (50,195) | (24,617) | ||
| Billings | $ 36,036 | $ 25,832 | $ 104,916 | $ 71,846 | ||