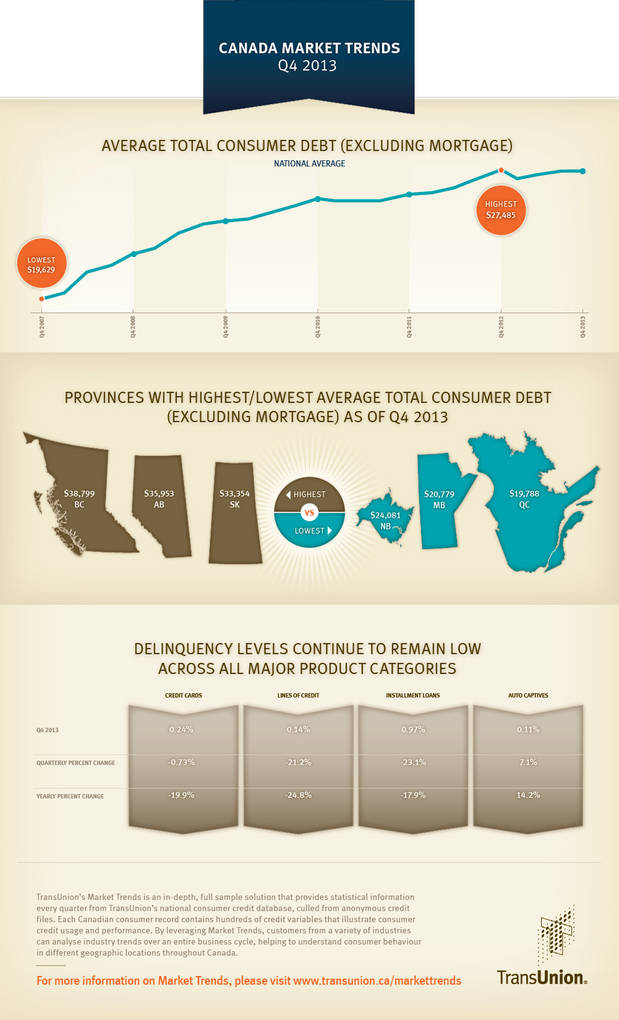
TORONTO, ON--(Marketwired - Feb 26, 2014) - TransUnion's quarterly analysis of Canadian credit trends found that the average consumer's total debt (excluding mortgage) in Q4 2013 increased marginally to $27,368 from $27,355 in Q3 2013. This quarterly increase of 0.05% was the lowest observed since a (-0.04%) decrease in Q3 2011. On a year-over-year basis, total debt decreased 0.42% from $27,485 in Q4 2012, which was the highest debt level on record.
"We generally observe increases in total debt during the fourth quarter because of the holiday shopping season," said Tom Higgins, TransUnion's vice president of analytics and decisioning services. "Total debt in in the fourth quarter remained essentially flat, which means Canadians may have begun potentially deleveraging, utilizing less credit this past holiday season. As in the recent past, we will need to observe this variable in the coming quarters to confirm if this is a new trend."
While average consumer debt levels were stagnant for the nation, Vancouver experienced significant increases, both quarterly and yearly. Montreal and Ottawa were the only cities showing increases in debt which were on a quarter-to-quarter basis. All the major cities, excluding Vancouver, posted noticeable decreases on a year-to-year basis.
| Balance/Person | Q4 2012 | Q1 2013 | Q2 2013 | Q3 2013 | Q4 2013 | PCT Q/Q | PCT Y/Y |
| Calgary | $39,824 | $38,419 | $38,167 | $37,920 | $37,646 | -0.72% | -5.47% |
| Edmonton | $33,005 | $31,719 | $31,625 | $31,658 | $31,478 | -0.57% | -4.63% |
| Montreal | $19,651 | $18,293 | $18,495 | $18,527 | $18,563 | 0.19% | -5.54% |
| Ottawa | $25,393 | $24,273 | $24,467 | $24,438 | $24,449 | 0.05% | -3.72% |
| Toronto | $25,395 | $23,833 | $24,127 | $24,067 | $24,063 | -0.02% | -5.25% |
| Vancouver | $38,357 | $40,390 | $40,412 | $40,174 | $41,077 | 2.25% | 7.09% |
"It's encouraging to see significant drops in debt for most of the major markets in Canada," said Higgins. "Vancouver is an outlier in this scenario, but it should be noted that their unemployment rate -- a major driver in consumer spending -- is much lower than what is observed in other larger cities such as Toronto and Montreal."
In Q4 2013, it was Alberta and Ontario that held back a more significant increase in quarterly debt per person being the only two provinces posting negative growth (-0.68 and -0.21% respectively). All other provinces grew quarter-to-quarter with Saskatchewan three times greater than the Canadian average (1.49%). On a yearly basis, most provinces fell in line with the Canadian decrease with British Columbia (4.17%), Saskatchewan (13.0%) and Newfoundland (1.74%) bucking the trend.
| Avg Consumer Debt | Q4 2012 | Q1 2013 | Q2 2013 | Q3 2013 | Q4 2013 | Q/Q Chg | Y/Y Chg | |||||||
| Canada | $27,485 | $26,935 | $27,131 | $27,355 | $27,368 | 0.05% | - 0.42% | |||||||
| British Columbia | $37,244 | $38,619 | $38,672 | $38,682 | $38,799 | 0.30% | 4.17% | |||||||
| Alberta | $37,377 | $36,223 | $36,150 | $36,200 | $35,953 | - 0.68% | - 3.81% | |||||||
| Ontario | $26,901 | $25,735 | $25,914 | $25,928 | $25,874 | - 0.21% | - 3.82% | |||||||
| Quebec | $20,102 | $19,131 | $19,455 | $19,695 | $19,788 | 0.47% | - 1.56% | |||||||
Consumer Debt - Quarterly/Yearly
Total consumer debt increases were seen across all product categories.
- Canadian average credit card borrower debt (defined as the aggregate balance on all credit cards for an individual bankcard borrower) posted a quarterly increase of 1.93%, helping to post its third consecutive year over year increase (2.27%).
- Canadian lines of credit (LOC) borrower debt (defined as the aggregate balance on all LOC for an individual LOC borrower) has reversed its year over year growth trend, down 5.34%, while posting its fourth consecutive decrease of 2.31% quarter over quarter.
- Canadian installment loan borrower debt (defined as the aggregate balance on all installment loans for an individual installment loan borrower) increased 3.95% year over year and a marginal 0.15% increase quarter over quarter.
- Canadian auto borrower debt (defined as the aggregate balance on all auto captive loans for an individual auto captive borrower) continued its decelerating growth year over year up only 1.95% while posting its first quarterly decrease (-0.59%) since Q1 2011.
| Q2 2012 |
Q3 2012 |
Q4 2012 |
Q1 2013 |
Q2 2013 |
Q3 2013 |
Q4 2013 |
|
| Credit Cards | $3,556 | $3,573 | $3,637 | $3,463 | $3,585 | $3,650 | $3,720 |
| Lines of Credit | $33,721 | $34,050 | $35,247 | $34,951 | $34,641 | $34,151 | $33,363 |
| Installment Loans | $22,493 | $22,849 | $23,224 | $23,269 | $23,735 | $24,107 | $24,142 |
| Auto Captives | $18,881 | $19,228 | $19,345 | $19,172 | $19,518 | $19,837 | $19,720 |
Consumer Delinquencies - Quarterly/Yearly
Delinquency levels for all product categories, excluding Auto Captives, showed more downward movement. Auto Captives showed delinquency increases both quarterly and yearly.
| Q4 2012 | Q1 2013 | Q2 2013 | Q3 2013 | Q4 2013 | Q/Q Chg | Y/Y Chg | |
| Credit Cards | 0.30% | 0.32% | 0.24% | 0.24% | 0.24% | -0.73% | -19.9% |
| Lines of Credit | 0.18% | 0.18% | 0.17% | 0.18% | 0.14% | - 21.2% | - 24.8% |
| Installment Loans | 1.18% | 1.18% | 1.14% | 1.26% | 0.97% | - 23.1% | - 17.9% |
| Auto Captives | 0.10% | 0.10% | 0.10% | 0.11% | 0.11% | 7.1% | 14.2% |
"Though we observed an increase in auto captive delinquencies, these levels are very low and are not a concern," said Chris Dias, TransUnion's senior vice president of product innovation and analytics. "The bigger story is the continued declines observed in delinquency rates for credit cards, lines of credit and installment loans. These are significant drops, and coupled with lower debt levels in some of Canada's major markets, this is a good story for both consumers and lenders. When both delinquencies and debt go down, we anticipate consumers may find more opportunities to gain access to better credit offers as competition for their business increases."
Three Highest Delinquency Provinces
| Credit Cards | Lines of Credit | Installment Loans | Auto Captives |
| PEI 0.48% | AB 0.19% | ON 1.50% | MB 0.26% |
| NB 0.41% | BC 0.18% | NS 1.42% | NS 0.22% |
| NS 0.36% | NS 0.16% | PEI 1.40% | NB 0.20% |
Three Lowest Delinquency Provinces
| Credit Cards | Lines of Credit | Installment Loans | Auto Captives |
| QC 0.21% | QC 0.09% | QC 0.45% | QC 0.06% |
| SK 0.20% | NL 0.09% | NL 0.90% | BC 0.09% |
| BC 0.23% | MB 0.11% | SK 0.73% | NL 0.09% |
TransUnion's Market Trends
TransUnion's Market Trends is an in-depth, full sample solution that provides statistical information every quarter from TransUnion's national consumer credit database, culled from anonymous credit files. Each Canadian consumer record contains hundreds of credit variables that illustrate consumer credit usage and performance. By leveraging Market Trends, customers from a variety of industries can analyze industry trends over an entire business cycle, helping to understand consumer behaviour in different geographic locations throughout Canada.
About TransUnion
As a global leader in information and risk management, TransUnion creates advantages for millions of people around the world by gathering, analyzing and delivering information. For businesses, TransUnion helps improve efficiency, manage risk, reduce costs and increase revenue by delivering high quality data, and integrating advanced analytics and enhanced decision-making capabilities. For consumers, TransUnion provides the tools, resources and education to help manage their credit health and achieve their financial goals. Through these and other efforts, TransUnion is working to build stronger economies worldwide. Based in Burlington, Ontario, with global headquarters located in Chicago, Illinois, TransUnion provides local service and support throughout Canada. Visit www.transunion.ca to learn more.
Contact Information:
Contact
Dave Blumberg
TransUnion
E-mail
Telephone 1 312 972 6646