MCLEAN, VA--(Marketwired - Jun 25, 2014) - Freddie Mac (
News Facts:
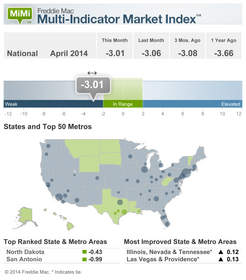
- The national MiMi value stands at -3.01 points indicating a weak housing market overall with only a slight improvement (+0.05 points) from March to April and a 3-month trend change of (+0.07 points), which is considered flat. However, on a year-over-year basis, the U.S. housing market has improved by 0.65 points. The nation's all-time MiMi low of -4.49 was in November 2010 when the housing market was at its weakest.
- Ten of the 50 states plus the District of Columbia are in their stable range with North Dakota, Wyoming, the District of Columbia, Louisiana and Alaska ranking in the top five with the latter two states trading places.
- Four of the 50 metro areas are in their stable range, San Antonio, Houston, Austin and New Orleans. Houston advanced two spots, New Orleans declined two. Texas metro areas now hold the top three spots.
- The five most improving states month-over-month were Illinois (+0.12), Nevada (+0.12) and Tennessee (+0.12), with Ohio, Rhode Island, and Texas all tied (+0.09). From one year ago the most improving states remained unchanged: Florida (+1.73), Nevada (+1.52), Texas (+0.98), South Carolina (+0.95) and California (+0.89). Texas moved up to the third most improving state from fifth place.
- The five most improving metro areas month-over-month are Las Vegas (+0.13), Providence (+0.13), Buffalo (+0.12) and Chicago (+0.11), while Houston, Memphis, Nashville and San Antonio all tied (+0.10). From one year ago the most improving metros remained unchanged: Miami (+2.25), Orlando (+1.75), Las Vegas (+1.60), Tampa (+1.46), and Riverside (+1.31).
- In April, 14 of the 50 states and 21 of the 50 metros are showing an improving three month trend. The same time last year, 42 states plus the District of Columbia, and 44 metros were showing an improving three month trend.
Quote attributable to Freddie Mac Chief Economist Frank Nothaft:
"With the latest release of MiMi we're seeing very slow improvement on the housing front with most markets still trying to move beyond stall speed. The MiMi indicators that are improving across the board show the local jobs picture getting better and seriously delinquent rates continuing to come down. Both indicators are critical to decreasing distress in local markets, but that's also putting more pressure on markets with thinning inventory, especially where short sales have fallen off dramatically. However, as you look at each of the individual markets MiMi tracks, they have their own unique dynamics and show housing markets recovering at different paces."
Quote attributable to Freddie Mac Deputy Chief Economist Len Kiefer:
"Texas is clearly a standout with three of its metros claiming the top five MiMi spots. However, states like South Carolina, Rhode Island and Ohio have showed marked improvement since just the beginning of the year. In fact, those metro areas that are closest to joining the handful of markets that have already achieved their stable range of housing activity are Pittsburgh and Oklahoma City, as is the state of Oklahoma. And solid jobs gains, attractive mortgage rates and good affordability will help this trend spread to even more markets. However, income growth and greater inventory is just as important if we're going to sustain any type of meaningful housing recovery."
MiMi monitors and measures the stability of the nation's housing market, as well as the housing markets of all 50 states, the District of Columbia, and the top 50 metro markets. MiMi combines proprietary Freddie Mac data with current local market data to assess where each single-family housing market is relative to its own long-term stable range by looking at home purchase applications, payment-to-income ratios (changes in home purchasing power based on house prices, mortgage rates and household income), proportion of on-time mortgage payments in each market, and the local employment picture. The four indicators are combined to create a composite MiMi value for each market. Monthly, MiMi uses this data to show, at a glance, where each market stands relative to its own stable range of housing activity. MiMi also indicates how each market is trending, whether it is moving closer to, or further away from, its stable range. A market can fall outside its stable range by being too weak to generate enough demand for a well-balanced housing market or by overheating to an unsustainable level of activity.
For more detail on MiMi see the FAQs. MiMi is released at 10 a.m. EDT monthly. The most current version can be found at FreddieMac.com/mimi.
Freddie Mac was established by Congress in 1970 to provide liquidity, stability and affordability to the nation's residential mortgage markets. Freddie Mac supports communities across the nation by providing mortgage capital to lenders. Today Freddie Mac is making home possible for one in four home borrowers and is one of the largest sources of financing for multifamily housing. Additional information is available at FreddieMac.com, Twitter @FreddieMac and Freddie Mac's blog FreddieMac.com/blog.