Contact Information: Media Contact: Michelle Sabolich Atomic PR for Clear Capital (415) 402-0230
Clear Capital(TM) Reports Late-Summer Softening of Home Price Gains and Reduced REO Saturation Rates
National Quarterly Price Gains (6.3%) Begin to Soften as We Move Into Fall and Winter; REO Saturation Rates (28.6%) Continue to Decline; Riverside, CA and Orlando, FL Return Quarterly Gains for the First Time in Three Years; and Baltimore, MD Ends Seven Quarters of Price Declines
| Source: Clear Capital
TRUCKEE, CA--(Marketwire - October 7, 2009) - Clear Capital (www.clearcapital.com), a premium
provider of data and solutions for real estate asset valuation, investment
and risk assessment, today released its Home Data Index™ (HDI) Market
Report. Patent pending rolling quarter technology significantly reduces the
multi-month lag time associated with other indices to help investors, loan
servicers and individual buyers and sellers make more informed, timely and
profitable decisions. This month's report features data compiled through
Sept. 25, 2009.
Key report highlights include:
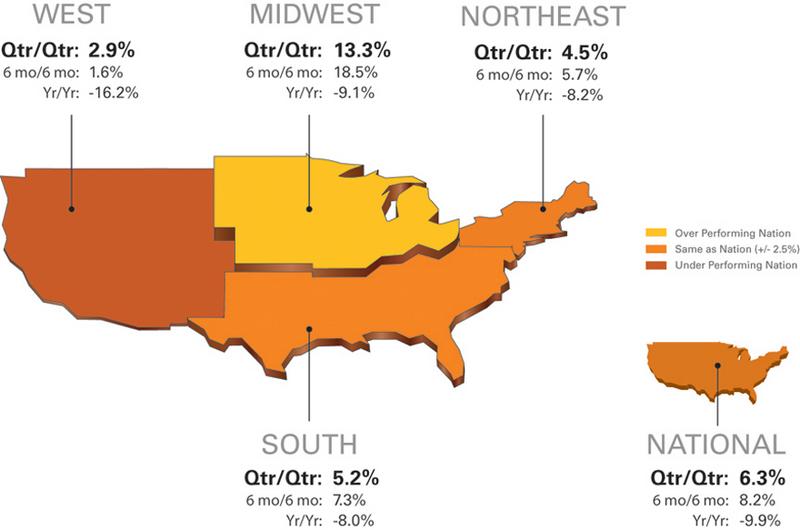
-- National / Four Region Overview: National quarterly price gains
soften to 6.3 percent, and the national yearly decline returns to the
single digit numbers (-9.9%) for the first time since summer of 2007.
The West region continues its price improvement, posting 2.9 percent
quarterly and 1.6 percent six-month gains. The national real estate
owned (REO) saturation rate (percentage of REOs sold to all properties
sold in the last rolling quarter) dropped to 28.6 percent.
-- Metropolitan Statistical Area (MSA) drilldown: Riverside, CA and
Orlando, FL return first positive quarterly price gains since mid-2006,
(0.5% and 1.2%, respectively).
-- Micro Market Analysis: Baltimore, MD returned positive quarterly
price gains (0.1%) after seven consecutive quarters of decline.
The Clear Capital HDI Market Report offers the industry, investors and
lenders a near real-time look at pricing conditions not only at the
national and metropolitan level, but within local markets. Clear Capital
data is built on the most recent data available from recorder/assessor
offices, and then further enhanced by adding the Company's proprietary
market data for the most comprehensive geographic coverage available.
"As anticipated, the strong gains we've been experiencing this summer are
showing signs of softening," said Kevin Marshall, Clear Capital President.
"But growth remains sufficiently strong -- providing hope as we head into a
winter that will test the strength of the recovery."
"Prices remain low, driving investor activity into the non-REO marketplace
across the nation. This is a good sign that the recovery is reaching beyond
the distressed segment," added Marshall. "Historically, investors move in
at the bottom which creates confidence for the bargain hunting fair-market
buyers to enter the market as well."
National/Four Region Market Overview (Aug. 27, 2008 - Sept. 25, 2009)
Quarterly price gains softened from last month, but remain substantial
across all four regions. The national year-over-year price decline was
trimmed by 2.2 percent from last month, producing the first single digit
loss (-9.9%) for the nation since the summer of 2007.
Generally seen as an improvement, the national REO saturation rate declined
1.5 percentage points to 28.6% from last month's quarterly value of 30.1
percent. With the reported decline being 3.2 percent last month, this
month's 1.5 point decline represents continued improvement, but at a
slowing rate. While the rate of improvement may be slowing, the impact of
declining saturation rates has been significant, with the current level
being 12.3 percentage points lower than the rates of last winter.
Despite the positive signs, a year-over-year price decline reminiscent of
2007 and marked reductions of the REO Saturation rate, we're still far from
the 10 percent REO saturation rates seen in 2007. Amid these conditions,
it's notable that the recent price gains have occurred alongside a record
number of REO sales, indicating that the reductions in REO Saturation has
been caused by non-REO sale volumes outpacing the growth in REO sales.
This demand for the non-REO segment is important if a broad recovery is to
be sustained.
The quarterly gains in the Midwest (13.3%) have brought its year-over-year
loss (-9.1%) close to that of the South (-8.0%) and Northeast (-8.2%),
leaving the West with the lowest quarterly gains (2.9%) and largest yearly
losses (-16.2%) for the group.
Metro Markets (Aug. 27, 2008 - Sept. 25, 2009)
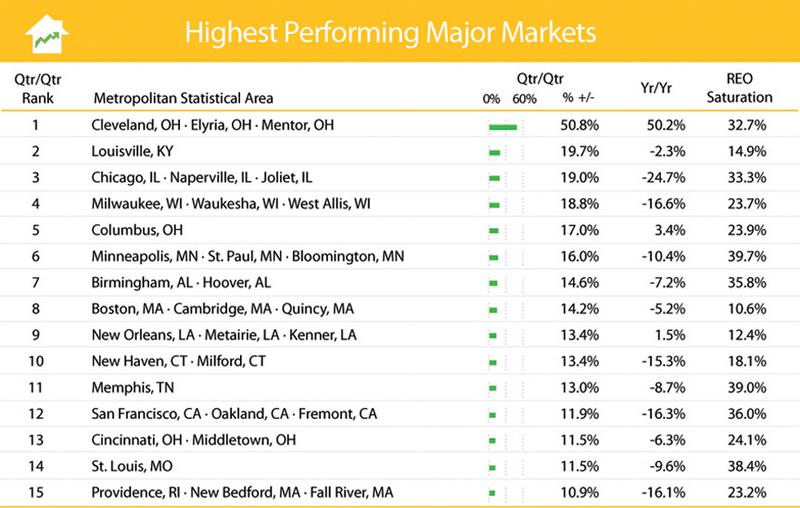
Spurred by a growing shift in sales to the non-REO segment of the market,
the
Cleveland, OH MSA paced the highest performing major markets for the fourth
month in a row, maintaining price gains of more than 50 percent. Even if
only the homes in the top price tier (homes valued at more than $160,000)
were counted, Cleveland would still return a 19.9 percent quarterly gain,
keeping it at the top of the list.
Overall, these markets continue to produce strong quarter-over-quarter
price gains, improving the year-over-year numbers for all but one of the
markets (Cincinnati, OH posted a minor -0.2 percent dip from last month).
Eleven of the fifteen markets saw decreased quarterly gains from those
reported last month. This marks a slowing of the price rate increases they
experienced over the past few months. While the slowing gains lead into the
seasonally slow fall and winter months, and questions remain about the
durability of the recovery, it's encouraging that REO saturation rates
continued to improve among twelve of the fifteen markets. The markets of
St. Louis, MO, San Francisco, CA, New Haven, CT, Columbus and Cleveland, OH
all experienced more than a two percent improvement (reduction) in REO
saturation rates this past month.
The San Francisco market, inclusive of the generally lower priced areas of
Oakland and Fremont, CA, appeared on the list for the first time with a
strong 11.9 percent quarterly gain and a 16 percentage point drop in REO
saturation from the previous quarter (March 2009 through May 2009). This
places San Francisco well below its peak REO saturation rate of 59.7
percent experienced last winter, and like in other markets, reflects a
broadening interest in non-REO properties.
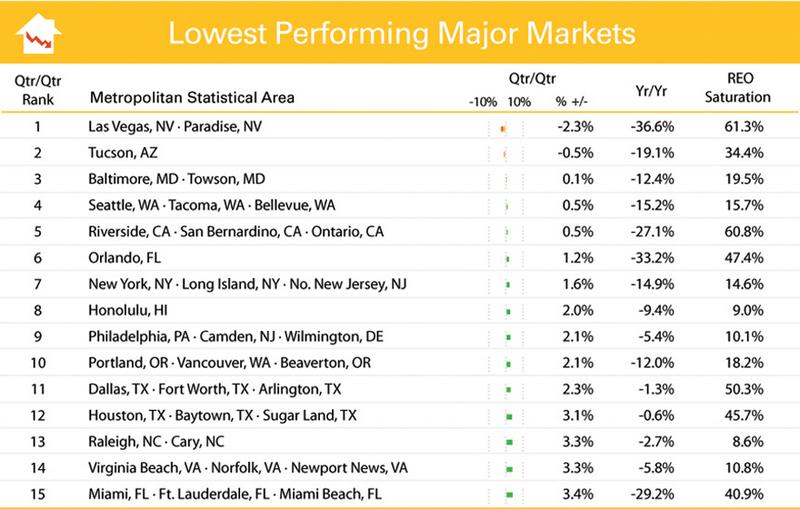
Of the lowest performing major markets, only the top two retain negative
quarter-over-quarter price changes this month; an improvement over the four
listed on last month's report. Orlando, FL and Riverside, CA saw their
first, albeit slight, quarterly price gains since mid-2006, while Baltimore
saw its first gain since the summer of 2007. Tucson, AZ faltered slightly,
giving up last month's 0.3 percent gain for a loss of -0.5 percent.
Las Vegas, NV and Riverside, CA (the two highest REO saturated markets)
lead the group with the largest declines in saturation from last month's
numbers with 2.7 and 2.9 point declines, respectively. While Las Vegas
maintained its position at the top of the lowest performing markets for the
fourth consecutive month, fewer REO sales and a slight improvement in
non-REO activity, helped this MSA to its softest quarterly price decline
(-2.3%) since the winter of 2007. Similarly, Riverside saw a slight
quarterly price gain helped by declining REO volumes and a steady number of
non-REO sales.
Though most markets on this list experienced softening price declines or
modest gains, several markets still have highly elevated saturation rates.
Compared to the highest performing major markets, where no market had an
REO saturation rate above 40 percent, the lowest performing major markets
list still finds six markets above 40 percent in REO saturation. This
indicates additional risk still exists for these markets unless the non-REO
segment can manage to maintain strength during the upcoming winter.
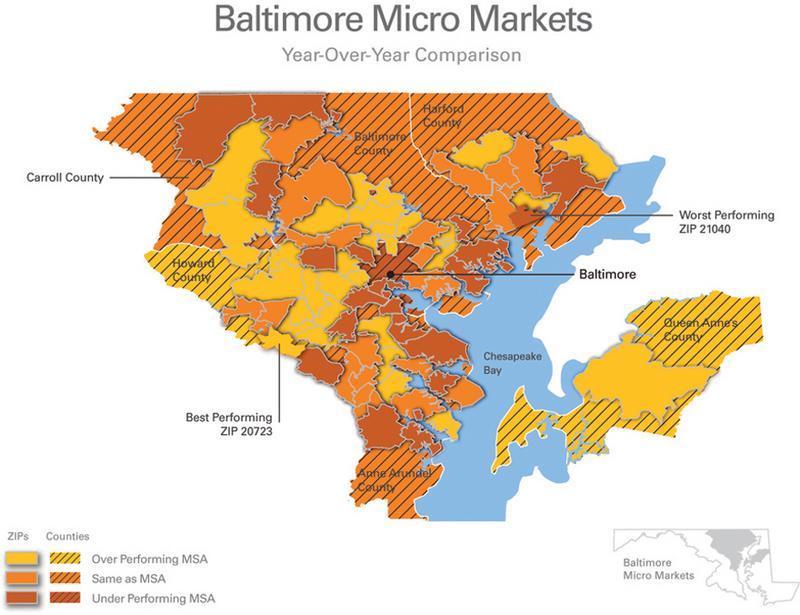
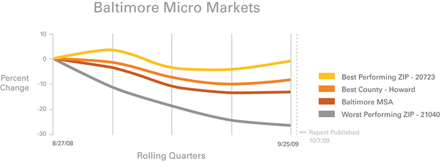
Micro Markets (Aug. 27, 2008 - Sept. 25, 2009)
This section highlights a single market every month with a deeper dive into
how the micro- and macro-markets relate to each other.
Baltimore's micro markets returned to a positive quarterly gain (0.1%)
after seven consecutive quarters of decline, contributing to a 21.0 percent
decline in home values since its market peaked in late 2006. As a whole,
the Baltimore market performed similar to much of the Northeast and South,
returning modest pricing declines compared to the national decline of -31.6
percent since the market peaked. REO saturation rates in Baltimore also
remained below the national rate, peaking at only 19.5 percent last spring.
However, a disparity exists within Baltimore's micro markets, with notable
differences between the REO-saturated city limits and the more distant
suburbs -- particularly those suburbs to the Southwest which are closer to
the better performing housing markets of Washington, D.C. Within the city
limits of Baltimore, REO saturation peaked last winter at 31.5 percent due
to declining non-REO sales amidst growing REO activity. These conditions
reflected a -17.7 percent decline in price the last year alone;
significantly worse than the more suburban southern counties of Carroll
(-11.7%) and Howard (-7.9%), which peaked at less than 19 percent REO
saturation.
While its market has not fully recovered, the suburban city of Laurel (ZIP
20723) is proving more resilient to price declines (-0.9%) this past year
than the Baltimore market as a whole. Laurel seems well-served by its
location between the two metro cores of Baltimore and Washington, D.C. and
its proximity to Interstate 95 and the Baltimore-Washington Parkway. Even
though Laurel has seen its number of REO sales grow over the past year, in
recent months the city has maintained a healthier amount of non-REO sales
activity than the city's core.
Edgewood (ZIP 21040), on the other hand, continues to perform well below
the Baltimore market, experiencing a -24.5 percent year-over-year price
change. REO saturation in Edgewood continues to climb and has reached 34.3
percent. Combine this with its predominantly lower-tier priced homes and
proximity to the Aberdeen Proving Ground, a nearby arsenal to the south;
Edgewood is the worst performing ZIP in the area.
Clear Capital Home Data Index™ Methodology
The Clear Capital Home Data Index (HDI) provides weighted paired sales, and
price-per-square-foot index models that use multiple sale types, including
single-family homes, multi-family homes and condominiums. These models are
combined with an address-level cascade to provide sale-type-specific
analysis for thousands of geographic areas across the country. The indices
include both fair market and institutional (real estate owned)
transactions. They also provide indicators of REO activity such as REO
discount rates, REO days on market and REO saturation. The Clear Capital
HDI generates indices in patent pending rolling quarter intervals that
compare the most recent four months to the previous three months. The
rolling quarters have no fixed start date and can be used to generate
indices as data flows in, or at any arbitrary time period.
About Clear Capital
Clear Capital (www.clearcapital.com) is a premium provider of data and
solutions for real estate asset valuation and risk assessment for large
financial services companies. Our products include appraisals, broker-price
opinions, property condition inspections, value reconciliations, and home
data indices. Clear Capital's combination of progressive technology, high
caliber in-house staff and a well-trained network of more than 40,000 field
experts sets a new standard for accurate, up-to-date and well documented
valuation data and assessments. The Company's customers include 75 percent
of the largest U.S. banks, investment firms and other financial
organizations.
Legend
Address Level Cascade - Provides the most granular market data available.
From the subject property, progressively steps out from the smallest market
to larger markets until data density and statistical confidence are
sufficient to return a market trend.
Home Data Index (HDI) - Major intelligence offering that provides
contextual data augmenting other, human-based valuation tools. Clear
Capital's multi-model approach combines address-level accuracy with the
most current proprietary home pricing data available.
Metropolitan Statistical Area (MSA) - Geographic entities defined by the
U.S. Office of Management and Budget (OMB) for use by Federal statistical
agencies in collecting, tabulating, and publishing Federal statistics.
Paired Sales Model - Weighted linear model based on repeat sales of same
property over time.
Price Per Square Foot (PPSF) Model - Median price movement of sale prices
divided by square footage over a period of time -- most commonly a quarter.
Real Estate Owned (REO) Saturation - Calculates the percentage of REOs sold
as compared to all properties sold in the last rolling quarter.
Rolling Quarters - Patent pending rolling quarters compare the most recent
four months to the previous three months.
The information contained in this report is based on sources that are
deemed to be reliable; however no representation or warranty is made as to
the accuracy, completeness, or fitness for any particular purpose of any
information contained herein. This report is not intended as investment
advice, and should not be viewed as any guarantee of value, condition, or
other attribute.