Quarterly Reported Data
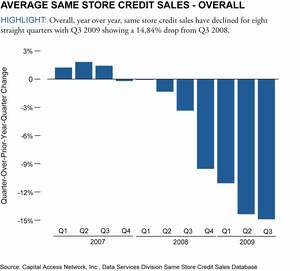
-- Average Same Store Credit Sales - Overall
-- Average Same Store Credit Sales - by Population Size
-- Average Same Store Credit Sales - by Industry and Ticket Size
-- Average Same Store Credit Sales - by Geographic Region
-- Total Processing Distribution - by Geographic Region
Key SBCS Report Highlights Q3 2009
1. Overall, year over year, same store credit and debit card sales have
declined for eight straight quarters with Q3 2009 showing a 14.84% drop
from Q3 2008.
2. While all MSAs* have experienced declining same store credit sales, less
populated areas (pop. < 100,000) showed the least decline, 9.81%, in Q3
2009 versus Q3 2008. The largest MSAs (pop. 1 million+) showed the greatest
decline, 16.59%, in Q3 2009 versus Q3 2008.
3. Restaurants were showing growing same store credit sales until Q3 2008
when they began declining. In Q3 2009 Restaurant credit sales dropped
11.06% from Q3 2008 levels. Retail/Service/Other industries continued their
relatively steep decline in credit sales in Q3 2009, dropping 18.46% from
Q3 2008.
SPOTLIGHT: Within the Restaurant category, those with less than a $25
average ticket have performed better than more expensive restaurants. While
those restaurants with less than a $25 average ticket have had year over
year declines in same store credit sales for the two most recent quarters,
restaurants with greater than a $100 average ticket have seen year over
year declines for four successive quarters.
4. In Q3 2009, most regions of the country showed signs of stabilizing
their year over year decline in same store credit sales. The Plains Region
and Rocky Mountain Region both slowed their rates of decline, but the
Plains Region still dropped 14.54% and the Rocky Mountain Region 9.39% in
Q3 2009 compared to Q3 2008.
SPOTLIGHT: The Southeast Region has been plagued by year over year declines
in same store credit sales for seven successive quarters beginning in Q1
2008. The declines can also be seen in month-over-prior-year-month data.
For 18 of the last 21 months, same store credit sales in the Southeast
Region have dropped compared to the same period in the previous year. In Q3
2009, this trend continued, with July, August and September 2009 each
showing double-digit declines from the same period in 2008. On a
quarter-over-prior-year-quarter basis, in Q3 2009, the Southeast Region
showed a 17.66% drop from the same period in 2008 -- the biggest year over
year quarterly decline for any Region in any period during the measurement
timeframe.
5. Total processing percentages by region have not fluctuated significantly
since 2008.
* Metropolitan and Micropolitan Statistical Areas as defined by the Office
of Management and Budget based on U.S. Census Bureau data.
About Capital Access Network, Inc.
Capital Access Network, Inc. (CAN), serves the small business market
through its wholly owned subsidiaries, including AdvanceMe, Inc., the
leader in Merchant Cash Advances. CAN leverages leading edge data, systems
and technology, married to a unique and highly effective collection
methodology, to deliver innovative financial products and services geared
to the small and mid-sized business markets. Founded in 1998 and
headquartered in New York, CAN and its subsidiaries currently employ 300
people in four locations in New York, Georgia, Massachusetts and Costa
Rica. CAN's Data Services Division was formed to provide predictive
analytics, scoring and other risk management tools to help quantify,
control or reduce the exposure of those providing capital or credit to
small and mid-sized businesses and to improve the marketing efficiencies of
those who target such businesses. CAN's Data Services Division draws upon
the data gathered by CAN's subsidiaries through 11 years of collecting and
analyzing the sales trends and firmographics of tens of thousands of
businesses to which they have provided capital or purchased future credit
card receivables. Learn more at www.CapitalAccessNetwork.com.
Contact Information: MEDIA CONTACT: Carrie Crabill Trevelino/Keller Communications Group 404-214-0722 x102 ccrabill@trevelinokeller.com