Contact Information: Media Contact: Michelle Sabolich Atomic PR for Clear Capital (415) 402-0230
Clear Capital(TM) Reports U.S. Home Price Gains Shrink to 3.7%
National Quarterly Price Gains Continue to Slow as the Winter Season Approaches; Investor Activity Helps Riverside, Calif. and Miami, Fla. Price Improvements; and Muted REO Influences Help Limit Price Declines in Seattle, Wash.
| Source: Clear Capital, Inc.
TRUCKEE, CA--(Marketwire - November 5, 2009) - Clear Capital (www.clearcapital.com), a premium
provider of data and solutions for real estate asset valuation, investment
and risk assessment, today released its Home Data Index™ (HDI) Market
Report. Patent pending rolling quarter technology significantly reduces the
multi-month lag time associated with other indices to help investors, loan
servicers and individual buyers and sellers make more informed, timely and
profitable decisions. This month's report features data compiled through
Oct. 25, 2009.
Report highlights include:
-- National / Four Region Overview: The national quarterly price change
extended its softening trend, posting a 3.7 percent gain, while the
national year-over-year price decline was trimmed again, producing single
digit losses for the second month in a row (-8.4%).
-- Metropolitan Statistical Area (MSA) drilldown: Quarterly price gains
remained strong among the highest performing major markets, helped by the
continued decline in the percentage of total sales that are real estate
owned (REO).
-- Micro Market Analysis: Steep declines in the first half of this past
year produced a -13.8 percent yearly price change for the Seattle MSA.
The Clear Capital HDI Market Report offers the industry, investors and
lenders a near real-time look at pricing conditions not only at the
national and metropolitan level, but within local markets. Clear Capital
data is built on the most recent data available from recorder/assessor
offices, and then further enhanced by adding the Company's proprietary
market data for the most comprehensive geographic coverage available.
"Nationally, both the top and bottom performing markets are converging to
modest quarterly changes, indicating a return to stable markets," said Alex
Villacorta, Sr. Statistician, Clear Capital. "As we've seen since the
spring season, many markets have returned to traditional seasonal
fluctuations and the strong summer gains are showing signs of slowing."
"The continued decline in REO saturation rates, as well as an increase in
the proportion of cash buyers in both distressed and fair market sales, are
an encouraging sign of investor optimism coming into the traditionally slow
months," added Villacorta. "If the home buyer tax credit is extended and
possibly expanded, it could add even more momentum through the slow months
to build up to a very strong spring in 2010 as more buyers are sensing that
home prices truly have hit the bottom of the current cycle."
National/Four Region Market Overview (Sept. 26, 2008 - Oct. 25, 2009)
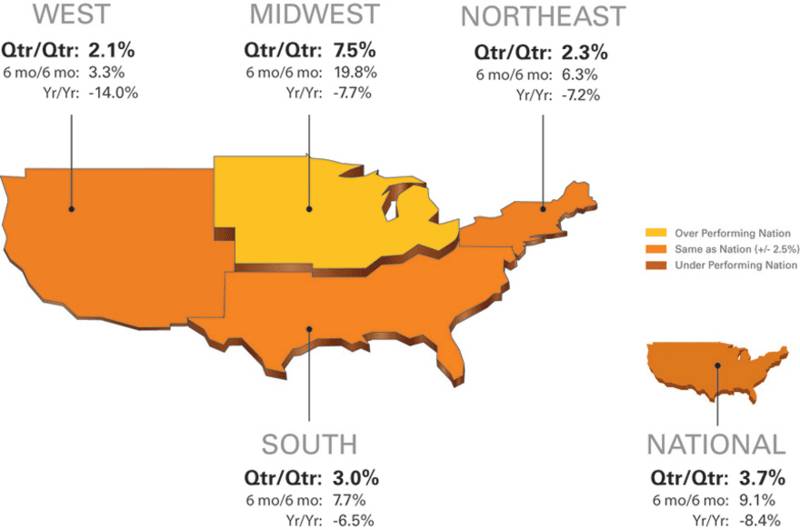
The national year-over-year price decline was trimmed another 1.5 percent
from last month, producing single digit losses for the second month in a
row (-8.4%). The national quarterly price change extended its softening
trend, posting 3.7 percent gains -- down from the 6.3 percent gains
experienced last month. This pattern held true across all four regions
which continue to post more consistent price changes, a likely reflection
of more uniform lending and foreclosure practices, along with a reduced
influence of the REO segment. This month's national REO saturation rate
declined to 28.0 percent -- a 5.1 percent improvement since July.
The softening gains reflect a step back from this year's strong summer
price increases spurred by the deeply discounted prices of last winter,
homebuyer incentives and a general sense by investors that the bottom of
the price decline was occurring. Investor activity does appear to be on the
rise. This past year, the proportion of REO purchases made with cash grew
12.4 percent. Homes purchased with cash, compared to a traditional
mortgage, are more prevalent among investors than those purchasing a
primary residence. The magnitude of this increase indicates investor
activity is contributing to the recent gains in home prices and has the
potential to carry us through the normally slower winter season.
Metro Markets (Sept. 26, 2008 - Oct. 25, 2009)
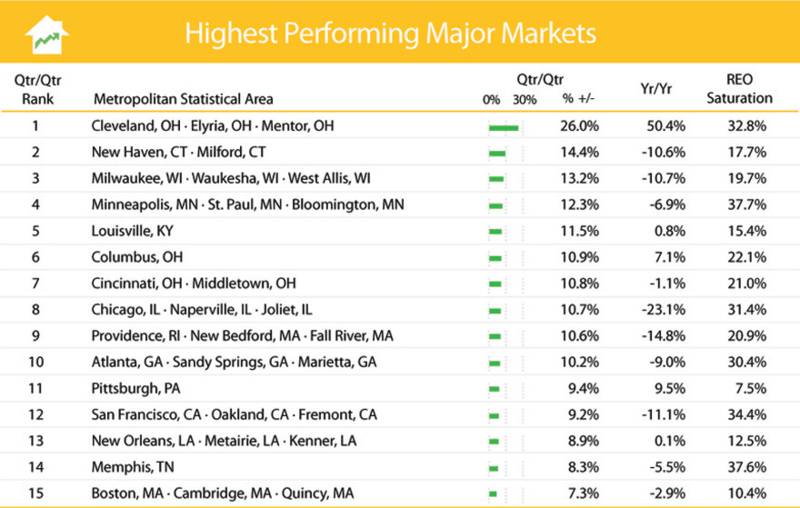
Quarterly price gains remain strong among the highest performing major
markets, helped by the continued decline in the percentage of total sales
that are real estate owned (REO). Only New Orleans, La., Louisville, Ky.
and Cleveland, Ohio saw increased REO saturation rates, and even then the
increases were slight (less than one-half percent each).
Excluding the additional one percent quarterly improvement in New Haven,
Conn., all the markets experienced slowing quarterly price gains,
continuing last month's general shift to more moderate gains. On average,
the highest performing major markets saw a decrease of 5.5 percent in their
quarterly gains. If this trend continues into the winter, it is possible
that some of the current top performers will see single digit quarterly
gains or even quarterly declines by the new year. This plausible scenario,
while a slowdown, would still represent a significant improvement from the
extreme and broad price declines and elevated REO saturation levels
experienced last winter.
Of particular note, the price spike we've seen in Cleveland has started to
diminish, dropping to 26.0 percent for the quarter, while continuing to
post a strong yearly price increase (50.4%). Cleveland returned a flat REO
saturation rate as compared to last month, as well.
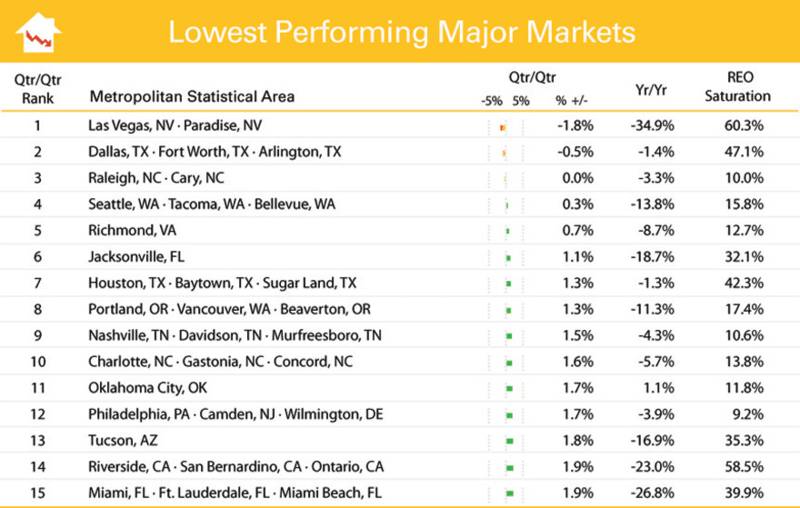
The lowest performing major markets continue to reflect the relatively
healthy changes that occurred across the nation in recent months, with only
two modest quarter-over-quarter losses present. However, the similarly
minor and reduced gains in these markets serve caution that we may
experience a pause in price increases as we head into winter. Las Vegas,
Nev., Tucson, Ariz. and Riverside, Calif. saw slight improvements in their
quarterly gains compared to last month, while the remaining 12 markets saw
continued gains but of reduced magnitude.
Raleigh, N.C. experienced the largest increase in REO saturation since last
month, but its modest 1.4 percent increase reflects a general stability in
these markets. Although five other markets (Seattle, Richmond,
Jacksonville, Charlotte and Tucson) experienced minor increases in REO
saturation, the average increase was just 0.7 percent. The remaining nine
markets saw declining REO saturation rates, generally seen as a positive
sign, with a combined average reduction of 2.1 percent.
The Riverside and Miami MSAs continue to experience improved results,
having dropped from near the top to the bottom of the list over the past
few months. Both are experiencing a much higher percentage of cash sales,
which is indicative of heightened demand by investors for all property
types, not just REOs. Historically, these markets have seen cash sales
account for less than ten percent of all non-REO sales. Currently,
Riverside is seeing 23.6 percent of all non-REO sales completed without
financing (i.e. cash sales), and Miami is experiencing an even greater 30.3
percent. These high percentages in non-REO cash sales highlight the
magnitude of investment activity which has spread beyond the REO segment.
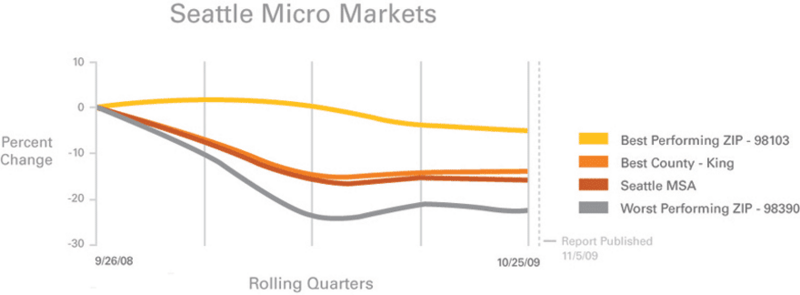
Micro Markets (Sept. 26, 2008 - Oct. 25, 2009)
This section highlights a single market every month with a deeper dive into
how the micro- and macro-markets relate to each other.
Steep declines in the first half of this past year produced a -13.8 percent
price change for the Seattle MSA. Compared to most of the major western
markets, however, the overall price decline in Seattle was less severe
because of muted REO influences. For the most part, Seattle's REO
saturation rate has remained below 20 percent percent, spiking briefly last
winter at 24.7 percent, before returning to its current rate of 15.8
percent.
A latecomer to the housing market decline, Seattle didn't experience a
reduction in prices until the fall of 2007 -- a full year after home prices
generally began to fall across the nation. Seven consecutive quarters of
decline followed, ending in an abrupt halt this past spring, making the
recovery to date resemble a floor. In total, Seattle home prices fell 23.4
percent since they peaked in the fall of 2007.
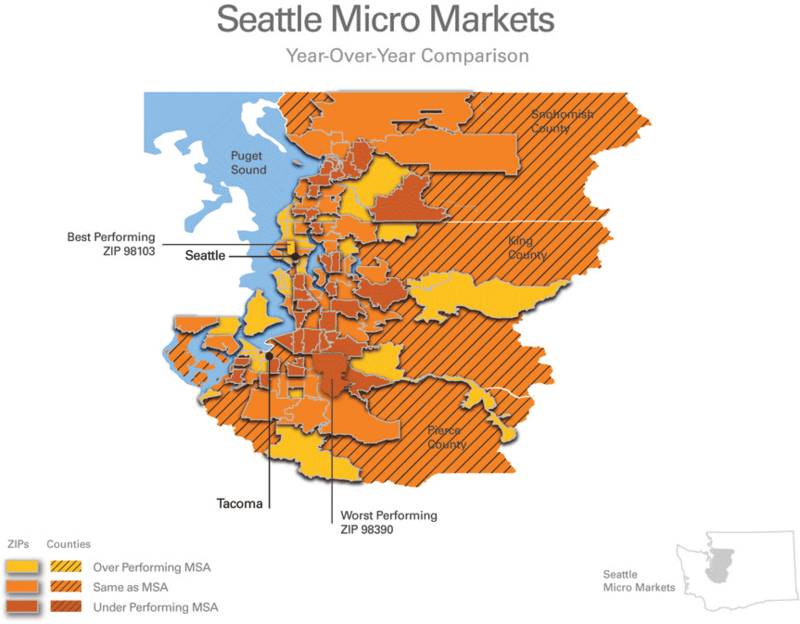
In contrast to last month's micro market report on Baltimore, Md., support
for home prices emanated from Seattle's popular city center. The urban and
scenic areas to the north of downtown, as compared to the more industrial
south end of town, have fared relatively well during the downturn.
Immediately north of the financial district and across Lake Union resides
the best performing area (ZIP 98103) with a price change of only -14.8
percent since the peak and -5.6 percent for the year. The close proximity
to downtown and the University of Washington has helped support home prices
in this neighborhood.
Well south of the city's core, and east of Tacoma, lies the small town of
Sumner (ZIP 98390). Lacking the financial base that benefits Seattle and
Tacoma, and outside the typical Seattle commute, Sumner represents the more
rural region of the micro market. While not substantially worse off than
its immediate neighbors, Sumner has experienced the greatest price decline
in the MSA for the year (-20.6%). Despite the steeper declines early in the
year, however, Sumner has followed the general trend for the MSA, reaching
a floor six months ago and has demonstrated a 1.2 percent gain since.
Clear Capital Home Data Index™ Methodology
The Clear Capital Home Data Index (HDI) provides weighted paired sales, and
price-per-square-foot index models that use multiple sale types, including
single-family homes, multi-family homes and condominiums. These models are
combined with an address-level cascade to provide sale-type-specific
analysis for thousands of geographic areas across the country. The indices
include both fair market and institutional (real estate owned)
transactions. They also provide indicators of REO activity such as REO
discount rates, REO days on market and REO saturation. The Clear Capital
HDI generates indices in patent pending rolling quarter intervals that
compare the most recent four months to the previous three months. The
rolling quarters have no fixed start date and can be used to generate
indices as data flows in, or at any arbitrary time period.
About Clear Capital
Clear Capital (www.clearcapital.com) is a premium provider of data and
solutions for real estate asset valuation and risk assessment for large
financial services companies. Our products include appraisals, broker-price
opinions, property condition inspections, value reconciliations, and home
data indices. Clear Capital's combination of progressive technology, high
caliber in-house staff and a well-trained network of more than 40,000 field
experts sets a new standard for accurate, up-to-date and well documented
valuation data and assessments. The Company's customers include 75 percent
of the largest U.S. banks, investment firms and other financial
organizations.
Legend
Address Level Cascade -- Provides the most granular market data available.
From the subject property, progressively steps out from the smallest market
to larger markets until data density and statistical confidence are
sufficient to return a market trend.
Home Data Index (HDI) -- Major intelligence offering that provides
contextual data augmenting other, human-based valuation tools. Clear
Capital's multi-model approach combines address-level accuracy with the
most current proprietary home pricing data available.
Metropolitan Statistical Area (MSA) -- Geographic entities defined by the
U.S. Office of Management and Budget (OMB) for use by Federal statistical
agencies in collecting, tabulating, and publishing Federal statistics.
Paired Sales Model -- Weighted linear model based on repeat sales of same
property over time.
Price Per Square Foot (PPSF) Model -- Median price movement of sale prices
divided by square footage over a period of time -- most commonly a quarter.
Real Estate Owned (REO) Saturation -- Calculates the percentage of REOs
sold as compared to all properties sold in the last rolling quarter.
Rolling Quarters -- Patent pending rolling quarters compare the most recent
four months to the previous three months.
The information contained in this report is based on sources that are
deemed to be reliable; however no representation or warranty is made as to
the accuracy, completeness, or fitness for any particular purpose of any
information contained herein. This report is not intended as investment
advice, and should not be viewed as any guarantee of value, condition, or
other attribute.