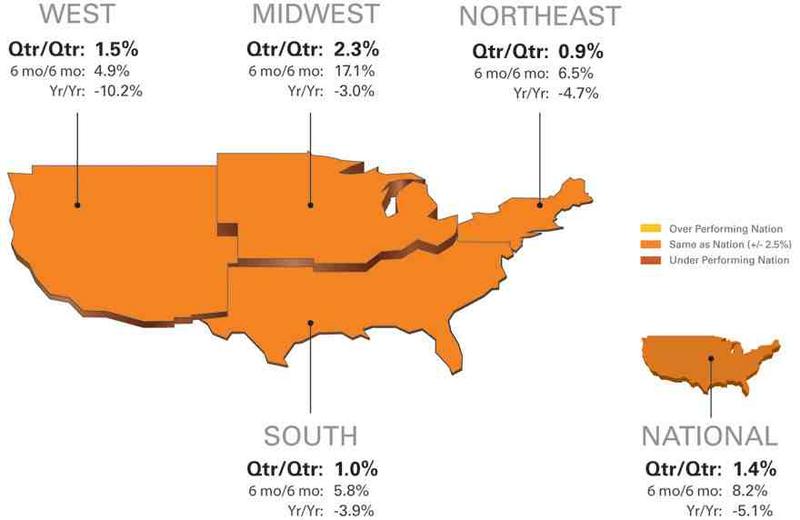
-- National / Four Region Overview: National quarterly price gains are
narrowed to a modest 1.4 percent; with the Midwest (2.3%), West (1.5%),
South (1.0%) and Northeast (0.9%) all posting modest gains.
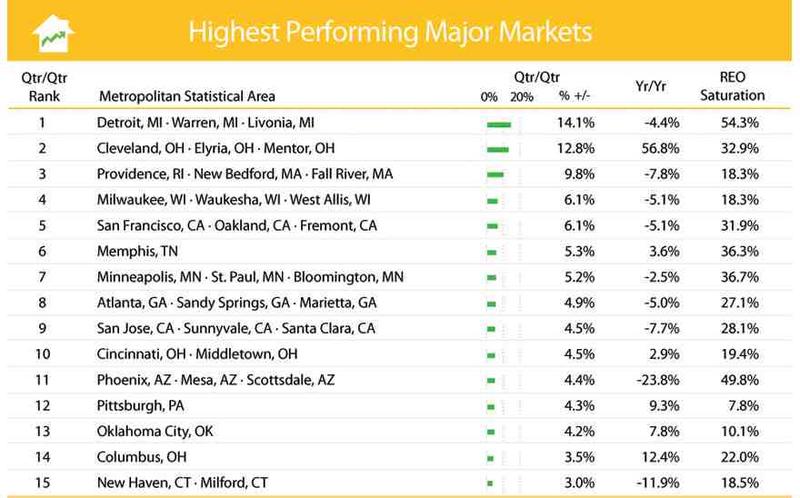
-- Metropolitan Statistical Area (MSA) drilldown: The highest performing
major markets continued to experience quarterly home price gains, further
minimizing yearly losses. Lake Erie cities of Detroit, Mich. (14.1%), and
Cleveland, Ohio (12.8%), top this month's highest performing major markets.
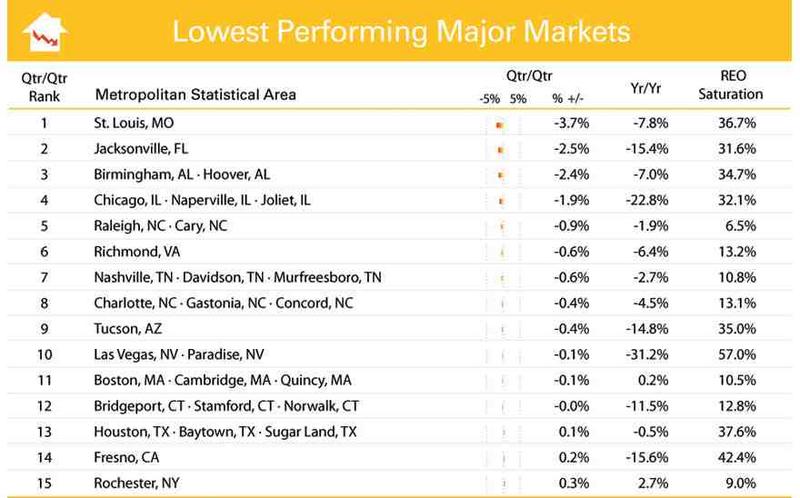
Softening seasonal home prices have returned most of the lowest performing
major markets to negative quarterly results.
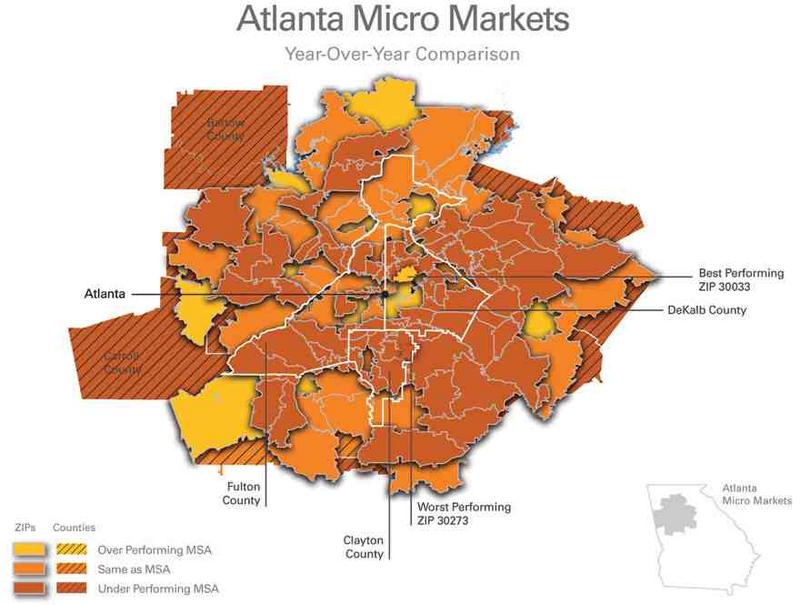
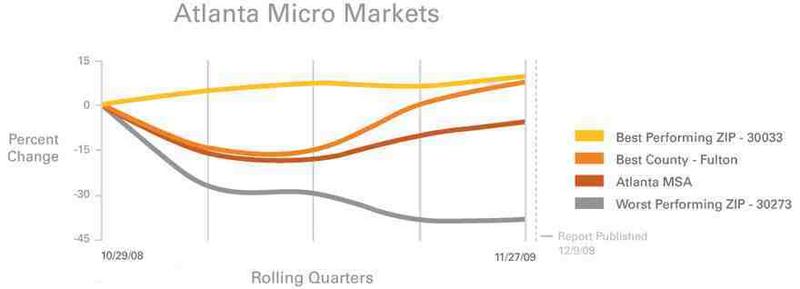
-- Micro Market Analysis: Home price gains of 13.4 percent over the last
two rolling quarters indicate prices in the Atlanta, Ga. MSA may have
bottomed out and are beginning to recover.
The Clear Capital HDI Market Report offers the industry, investors and
lenders a near real-time look at pricing conditions not only at the
national and metropolitan level, but within local markets. Clear Capital
data is built on the most recent data available from recorder/assessor
offices, and then further enhanced by adding the Company's proprietary
market data for the most comprehensive geographic coverage available.
"The modest and improving yearly changes we're seeing at the National and
Regional levels show that many areas have sustained stable price levels for
nearly all of 2009 after the dramatic fall off in prices in the preceding
three years," said Dr. Alex Villacorta, Senior Statistician, Clear Capital.
"Yet, the continued rolling quarter declines experienced over the past two
months have helped confirm that seasonal influences have returned."
"Even with a potential increase in REO saturation rates, many markets are
still showing strong evidence of stabilizing, indicating signs of a price
bottom," added Villacorta. "With the passing of the tax credit helping to
strengthen the momentum through the winter, many buyers may find that this
season is a good time to take advantage of record low prices."
National/Four Region Market Overview (Oct. 29, 2008 - Nov. 27, 2009)
Seasonal softening in the housing market this fall continues, placing the
nation's quarterly gains at a modest 1.4 percent. That's less than half the
3.7 percent returned last month, and nearly five percentage points less
than the 6.3 percent gains reported for September. All four regions
continued to show quarterly gains this month, with the spread in gains
narrowing again, reflecting more consistent price changes among the
regions. Particularly encouraging is the West region which continues to see
moderate price gains among its largest and highly REO-influenced markets.
While the seasonal cycles are still eclipsed by the magnitude of declines
since the market peaked in 2006, the return to seasonality this winter
could expose the dynamics of REO inventories. The traditionally slower
winter season is associated with a reduced number of home sales and an
increase in marketing times. REO properties, on the other hand, are
typically priced to sell in a given timeframe regardless of season.
The net result of combining the two dynamics of seasonal downturn and REO
property liquidations is likely increased REO saturation rates in the
winter months. It's important to note that these increased REO saturation
rates should not necessarily be interpreted as an increase in REO volume.
Declining REO saturation rates during the winter are more difficult to
achieve and any such decrease would be seen as a very good sign that demand
has returned to the marketplace. Even modest increase in REO saturation
rates this winter, more than likely would not signal an end of the recent
recovery.
Illustrating what could be a good sign of things to come this winter,
national REO saturation rates did continue a downward trend this month,
dropping another 1.1 percentage points to 26.9 percent.
Metro Markets (Oct. 29, 2008 - Nov. 27, 2009)
All of the highest performing major markets continue to experience
quarterly home price gains, further eroding yearly losses. Thirteen of the
fifteen markets saw improvements in their yearly gains over last month. The
magnitude of the quarterly gains demonstrates the dire state of the market
a year ago, while the improvements in the yearly returns indicate markets
are stabilizing.
A Lake Erie connection was made atop this month's list of highest
performing major markets. Detroit, which narrowly missed the highest
performing markets list last month, ended Cleveland's five-month reign as
the highest performing major market by posting a 14.1 percent quarterly
gain. Detroit's strong quarterly price gain reduced its yearly price
decline to -4.4 percent. One of the hardest hit areas in the country in
regards to home price declines, Detroit's large percentage home price gains
this rolling quarter are reflective of the low prices still present in the
area. When compared to the current median sale price of $63,000, Detroit's
14.1% quarterly gain translates to an approximately $7,800 increase over
last quarter's median value.
Phoenix, Ariz., a longtime leader of the lowest performing major markets,
moved into the highest performing list this month with solid quarterly
gains (4.4%) offsetting its list-leading 23.8 percent loss for the year.
Northern California's Bay Area is well represented in this month's highest
performing list. Both the San Francisco (6.1%) and San Jose (4.5%) MSAs
turned in solid gains, putting them within striking distance of eliminating
yearly losses.
REO saturation rates decreased from last month in twelve of fifteen markets
by an average 1.8 percent (New Haven, Conn.; Pittsburgh, Pa.; and Cleveland
experienced minor REO saturation increases of 0.8, 0.3 and 0.1 percent,
respectively). The continued general decrease in REO saturation across this
list is a positive sign as we prepare to enter the winter months that, as
stated previously, traditionally experience a rise in REO saturation.
The softening seasonal home prices have returned most of the major markets
on the lowest performing list to negative quarterly results. These declines
remain generally minor, however (less than 3.8%). Las Vegas, Nev. (-0.1%)
was the only MSA on this list to see its quarterly price change improve
from last month (-1.8%), enough to push it to tenth place this month from
its top position on this list last month.
While quarterly price changes continue to show slight dips into negative
territory, annual price changes are improving. Every MSA except for
Rochester, N.Y. saw yearly price improvements in this month's report. This
reflects the seasonal influence on the quarterly numbers, while the yearly
numbers reflect a solid improvement over last year.
Fresno, Calif. has improved since it last appeared on this list three
months ago. While still experiencing high REO activity (42.4%), Fresno's
-15.6 percent yearly price change is a substantial improvement over the
-25.9 percent yearly price change and 48.2 percent REO saturation posted
three months ago.
Houston, Texas; Raleigh, N.C.; and Las Vegas, Nev. saw the largest declines
in REO saturation, 4.7, 3.5 and 3.3 percent, respectively. This late in the
buying season, it's a positive sign to see the lowest performing major
markets continue to see declines in REO saturation, reduced yearly losses
and significantly improved quarterly gains compared to one year ago.
Micro Markets (Oct. 29, 2008 - Nov. 27, 2009)
This section highlights a single market every month with a deeper dive into
how the micro- and macro-markets relate to each other.
Home prices in the Atlanta, Ga. micro markets have returned to levels not
seen in eleven years. Furthermore, if inflation is taken into account,
current home prices would fall even farther below 1998's market, placing
today's prices at a level not seen since 1994. While this picture is grim
if considered by itself, it serves to highlight how discounted much of the
Atlanta MSA has become. It also adds perspective into the 13.4 percent
price gains experienced over the last two rolling quarters -- a substantial
number given the average quarterly gain over the past ten years was 1.7
percent.
While home price changes in Fulton County have generally outpaced DeKalb
County over the past year (7.7% vs. -4.5%), the unincorporated area of
DeKalb County just north of the county seat of Decatur (ZIP 30033) has
demonstrated remarkable home price stability. Decatur, the best performing
ZIP code among Atlanta's micro markets, has experienced an 8.7 percent
price gain this past year, and only a modest -3.5 percent change since home
prices peaked in 2006. Decatur has benefited from low REO volatility, its
proximity to Emory University, and immediate access to downtown Atlanta.
At the other end of the price performance spectrum lies Rex (ZIP 30273), an
unincorporated part of Clayton County southeast of downtown Atlanta. Rex
has an REO saturation rate twice as high as that of the greater Atlanta
area, resulting in price changes of -38.9 percent over the past year. This
annual price drop has added to Rex's decline, which has now returned a
-65.0 percent price change since this market peaked in 2006.
Clear Capital Home Data Index™ Methodology
The Clear Capital Home Data Index (HDI) provides weighted paired sales, and
price-per-square-foot index models that use multiple sale types, including
single-family homes, multi-family homes and condominiums. These models are
combined with an address-level cascade to provide sale-type-specific
analysis for thousands of geographic areas across the country. The indices
include both fair market and institutional (real estate owned)
transactions. They also provide indicators of REO activity such as REO
discount rates, REO days on market and REO saturation. The Clear Capital
HDI generates indices in patent pending rolling quarter intervals that
compare the most recent four months to the previous three months. The
rolling quarters have no fixed start date and can be used to generate
indices as data flows in, or at any arbitrary time period.
About Clear Capital
Clear Capital (www.clearcapital.com) is a premium provider of data and
solutions for real estate asset valuation and risk assessment for large
financial services companies. Our products include appraisals, broker-price
opinions, property condition inspections, value reconciliations, and home
data indices. Clear Capital's combination of progressive technology, high
caliber in-house staff and a well-trained network of more than 40,000 field
experts sets a new standard for accurate, up-to-date and well documented
valuation data and assessments. The Company's customers include 75 percent
of the largest U.S. banks, investment firms and other financial
organizations.
Legend
Address Level Cascade -- Provides the most granular market data available.
From the subject property, progressively steps out from the smallest market
to larger markets until data density and statistical confidence are
sufficient to return a market trend.
Home Data Index (HDI) -- Major intelligence offering that provides
contextual data augmenting other, human-based valuation tools. Clear
Capital's multi-model approach combines address-level accuracy with the
most current proprietary home pricing data available.
Metropolitan Statistical Area (MSA) -- Geographic entities defined by the
U.S. Office of Management and Budget (OMB) for use by Federal statistical
agencies in collecting, tabulating, and publishing Federal statistics.
Paired Sales Model -- Weighted linear model based on repeat sales of same
property over time.
Price Per Square Foot (PPSF) Model -- Median price movement of sale prices
divided by square footage over a period of time -- most commonly a quarter.
Real Estate Owned (REO) Saturation -- Calculates the percentage of REOs
sold as compared to all properties sold in the last rolling quarter.
Rolling Quarters -- Patent pending rolling quarters compare the most recent
four months to the previous three months.
The information contained in this report is based on sources that are
deemed to be reliable; however no representation or warranty is made as to
the accuracy, completeness, or fitness for any particular purpose of any
information contained herein. This report is not intended as investment
advice, and should not be viewed as any guarantee of value, condition, or
other attribute.
Contact Information: Media Contact: Michelle Sabolich Atomic PR for Clear Capital (415) 402-0230