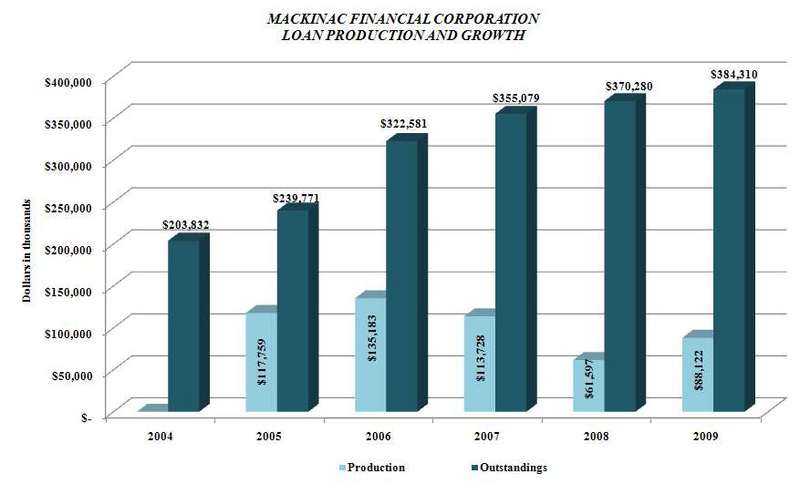
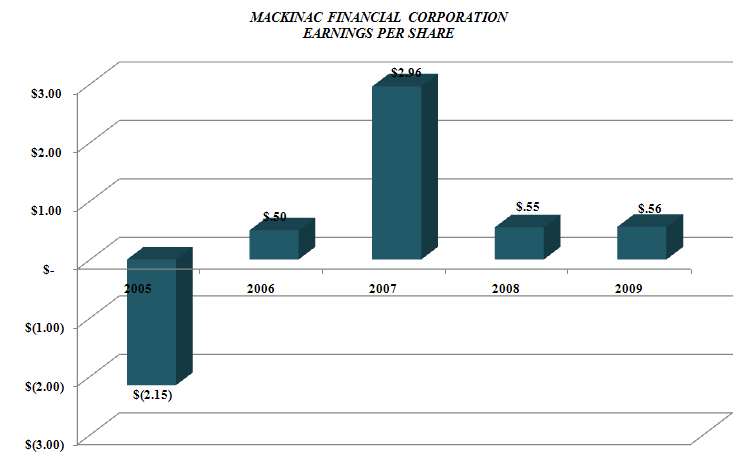
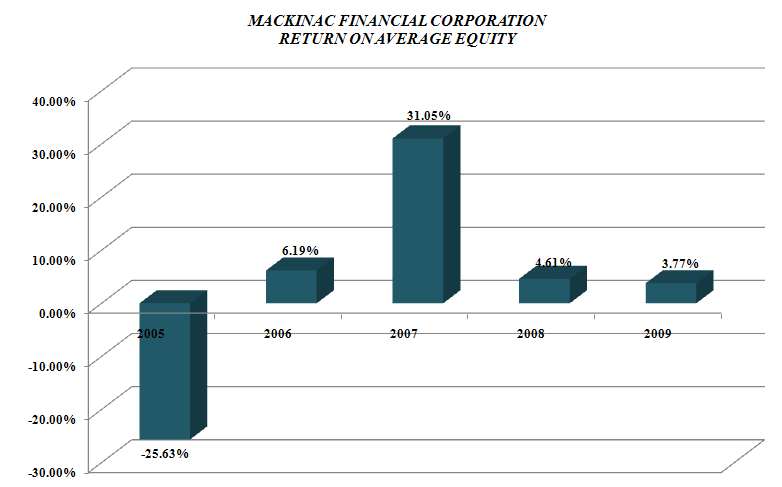
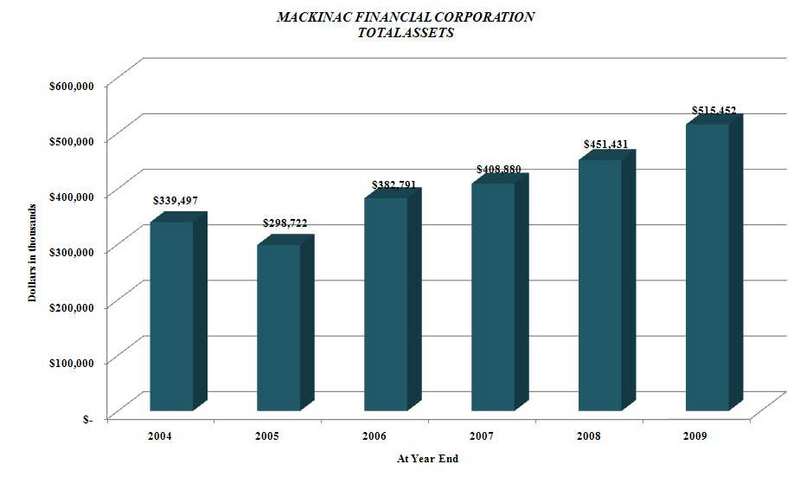
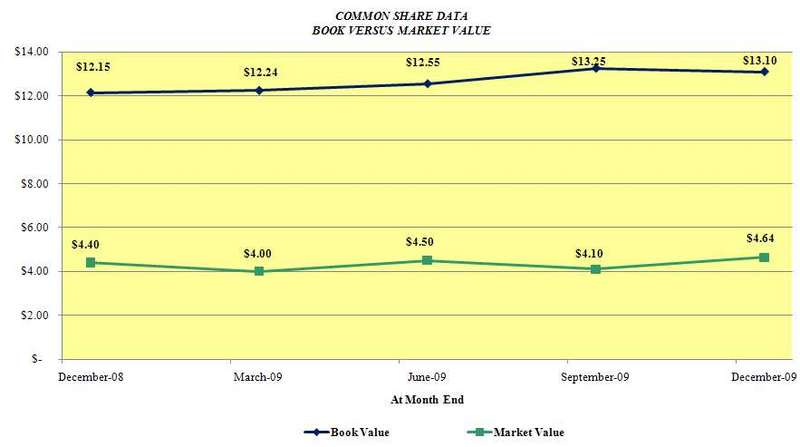
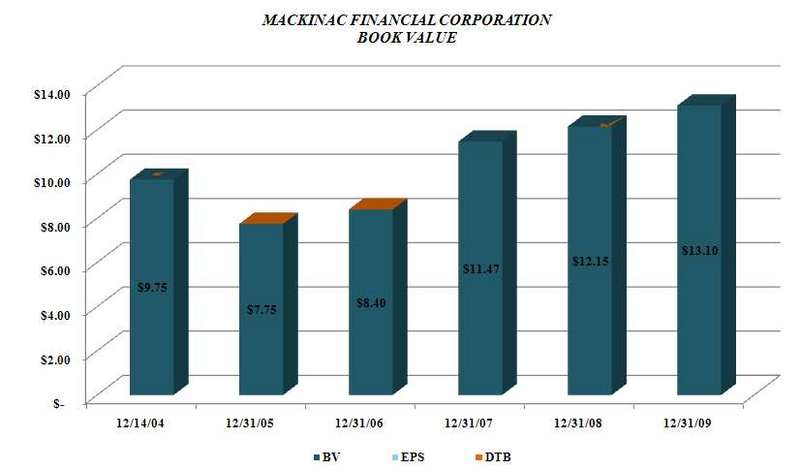
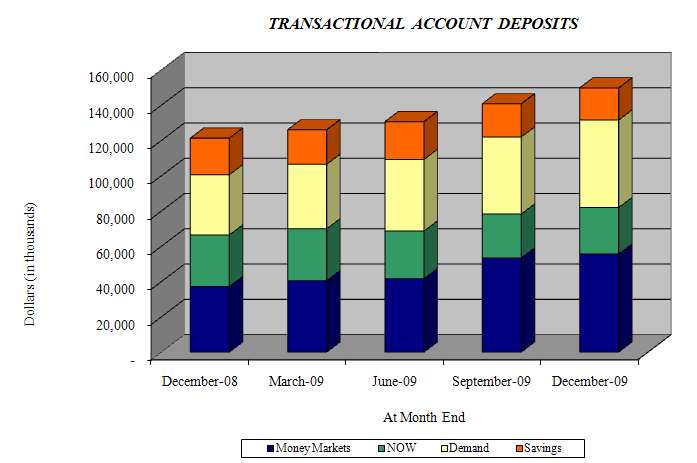
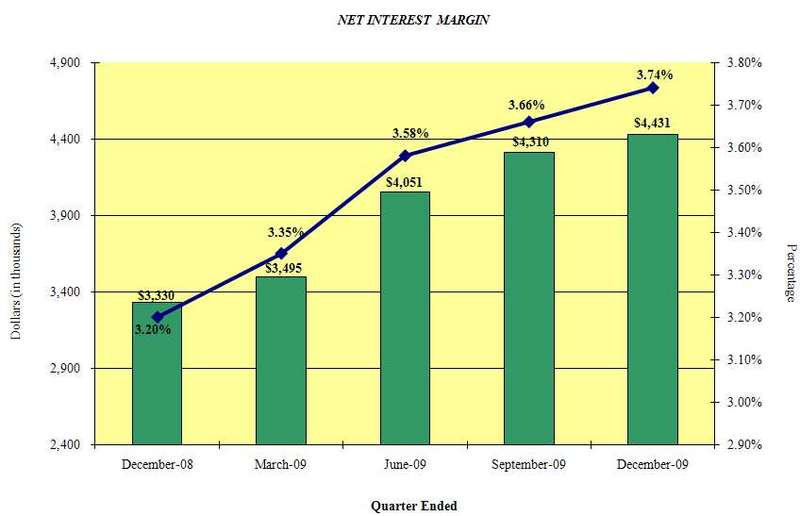
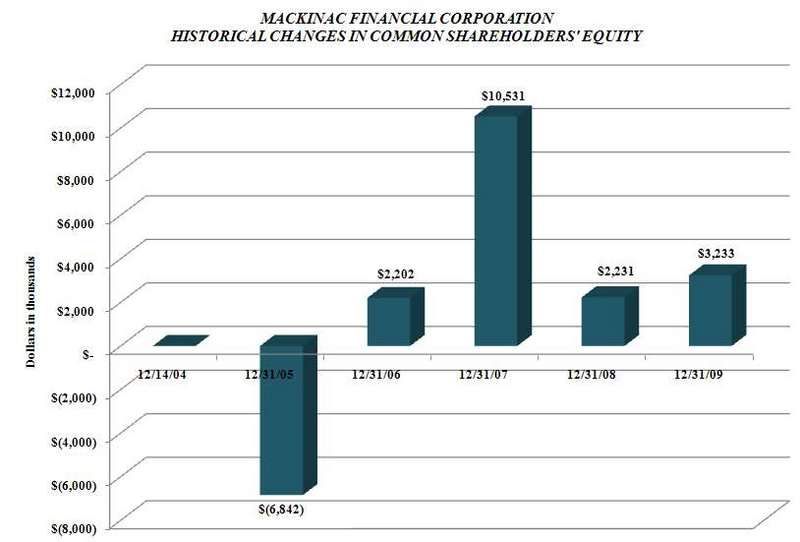
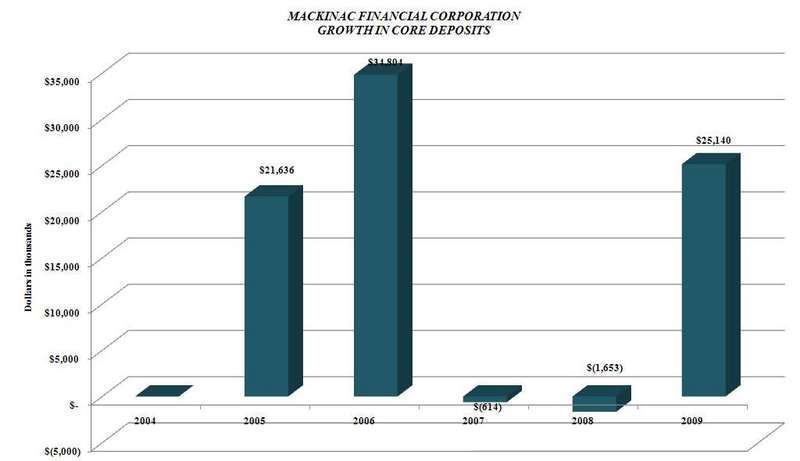
-- In 2009 book value per share increased by $.95 to $13.10. This marks
   the fourth consecutive year of increased shareholder value and a
   cumulative book value increase of $3.35 per share since the December
   2004 recapitalization at $9.75 per share.

-- We grew bank deposits by $26 million, net after the sale of two branch
   offices with $30 million in core deposits. We experienced deposit
   growth in all of our markets, with $26 million in Northern Lower
   Michigan, $20 million in Southeast Michigan and $10 million in the
   Upper Peninsula. Most of our 2009 deposit growth occurred in low cost
   transactional accounts which grew by $41 million.

-- We continued to experience good loan demand with approximately $88
   million of new loan production with a $14 million increase in loans
   outstanding, after reductions for amortization and payoffs. We were
   successful in producing loans in all of our markets but were less
   aggressive in Southeast Michigan where the recession is severe.
   Loan production totaled $44 million in the Upper Peninsula, $35
   million in Northern Lower Michigan and $9 million in Southeast
   Michigan.

-- In 2009 mBank was recognized as the top SBA loan originator in the
   Upper Peninsula with 27 SBA transactions, totaling $7.4 million. mBank
   totals equated to seventh overall for the State of Michigan with 36
   transactions and $13.2 million.

-- We improved our net interest margin from 3.20% in the fourth quarter of
   2008 to 3.74% in 2009's fourth quarter.

-- We continued to focus on enhancing our core earnings by controlling
   noninterest expense, increasing noninterest income and margin
   improvement. The combination of these three factors resulted in a
   decrease in our efficiency ratio from 86% in 2008 to 73% in 2009.

-- We had an increase in nonperforming assets from $7 million at 2008
   year end to $21 million at the end of 2009. Despite the appearance of
   this increase, we do not have systematic loan issues.  The increase for
   2009 included three large credit relationships totaling $10 million,
   for which we believe we are adequately reserved. The nonperforming
   assets by region are as follows; $13 million in Southeast Michigan,
   $6 million in Northern Lower Michigan and $2 million in the Upper
   Peninsula.
Following is more detailed information concerning our 2009 results. We have also included, as a part of this release a "Five Year Overview" which illustrates the progress of MFNC in terms of key shareholder metrics, since the recapitalization which occurred in December 2004. As this overview depicts, throughout the national and state specific economic challenges over the past several years, we have continued to improve the core operating platform of MFNC. In April of 2009, the Corporation, in an abundance of caution, decided to participate in the TARP program and issued $11 million of preferred stock. In order to offset the cost of the preferred, we infused a portion of the TARP proceeds, $3 million, into the Bank and leveraged this excess capital by purchasing approximately $40 million of investment securities. We funded the purchase of these investments by issuing brokered deposits. In December, we began the process of deleveraging this position in anticipation of narrowing spreads and recognized a fourth quarter security gain of $.827 million. This strategy has resulted in overall security gains in excess of $1 million. The net income of $1.907 million, $.56 per share, along with an increase in the unrealized value of securities held for sale contributed to the 2009 overall increase in common shareholders' equity of $3.233 million, or 7.8%. Paul Tobias, Chairman of MFNC, commenting on the overall results for 2009, stated, "Although our results in 2009 were stymied by a worsening national economy and the severe deterioration that occurred in the automotive industry and Michigan real estate markets, we still made significant progress to increase our franchise value. We were able to absorb increases in loan loss provisions, FDIC insurance premiums, and costs associated with higher levels of nonperforming assets and still post an overall increase in common shareholders' equity which equated to $.95 per share." At 2009 year-end, the Corporation's loans stood at $384.310 million, an increase of $14.030 million, or 3.79%, from 2008 year-end balances of $370.280 million. Total loan originations in 2009 amounted to $88.122 million. Loan amortization and principal payoffs totaled $60.415 million. A good portion of these payoffs pertained to loan relationships that no longer met our pricing or credit standards. Loan growth was primarily from the Upper Peninsula markets where the economy is more stable. Total assets of the Corporation at December 31, 2009 were $515.377 million, an increase of $63.946 million, or 14.17% from total assets of $451.431 million reported at December 31, 2008. Total deposits grew from $371.097 million at December 31, 2008, to $421.389 million at December 31, 2009, an increase of $50.292 million, or 13.55%. This increase is composed of an increase in wholesale brokered deposits of $24.288 million and an increase in bank deposits of $26.004 million. During 2009, we increased investment securities which were funded primarily with wholesale deposits that were priced lower than in-market deposits. In August of 2009 we completed the sale of $30 million in deposits including the bank facilities of two branch offices in Upper Michigan which resulted in a $1.208 million gain. Kelly George, President and Chief Executive Officer of mBank, commenting on the deposit growth and branch sales, stated, "The sale of these branches tightened up our existing footprint in the Upper Peninsula and will allow us to concentrate on markets with higher growth potential, in addition to enabling the Corporation to strategically transition the Bank's footprint into 'commercial hubs' of the Upper Peninsula to better allocate personnel resources and management time. We continue to focus our efforts on growing transactional accounts and were successful in growing demand, money market and NOW accounts in total from $121.413 million at 2008 year-end to $149.875 million at 2009 year-end." Net interest income for the year ended December 31, 2009 was $16.287 million compared to $12.864 million for the year ended December 31, 2008, an increase of $3.423 million. The margin percentage for 2009 was 3.59% compared to 3.23% in 2008 and 3.60% in 2007. We recognize the importance of cost control, especially in times of economic slowdown. In 2009 our total noninterest expense was $13.802 million compared to $12.558 million in 2008 and $12.100 million in 2007. The increase in 2009 was primarily attributable to costs associated with higher levels of nonperforming assets and increased FDIC insurance premiums. Salaries and benefits were reduced from $6.886 million in 2008 to $6.583 million in 2009. Nonperforming assets increased in 2009 as the economy continued to weaken, especially in Southeast Michigan. Nonperforming loans totaled $15.237 million, or 3.96% of total loans at December 31, 2009. Nonperforming assets at December 31, 2009 were $21.041 million, 4.08% of total assets, compared to $7.076 million or 1.57% of total assets at December 31, 2008. Kelly George commented, "The elevated level of nonperforming assets, while still below peers and manageable, does concern us given the challenges throughout the state. We do not have a systematic problem with our overall loan portfolio, with over 58%, $8.8 million, of our problem loans stemming from two credit relationships in Southeast Michigan that we continue to devote significant attention to in order to reduce nonperformers in a timely manner and with minimal income statement impact. In retrospect, these large loans appeared sound and adequately collateralized at inception; however, as the economy worsened and real estate values declined, the borrowers have not been able to weather the storm. This in turn has led to a very cautious approach in all markets, but particularly in Southeast Michigan, which includes an emphasis on smaller loans and very conservative collateral valuations. We continue to focus on early identification and resolution of all our problem credits to minimize carrying costs, collateral deterioration and incremental loss." Shareholders' equity totaled $55.299 million at December 31, 2009, compared to $41.552 million at the end of 2008, an increase of $13.747 million. This increase includes $10.5 million of preferred stock that was issued by MFNC as a TARP recipient, consolidated net income of $1.907 million, the capital contribution impact of stock options and also the increase in equity due to the increase in the market value of held-for-sale investments, which amounted to $.648 million. Mr. Tobias concluded, "We will continue to consider all business combination options that would create shareholder value, but we have built our business plan on resolving the existing asset quality problems, building core deposits and managing costs. We believe that our book value growth has been significant and franchise value will be recognized by the market when the perception of Michigan and the confidence in the asset quality component of banking improves." Mackinac Financial Corporation is a registered bank holding company formed under the Bank Holding Company Act of 1956 with assets in excess of $500 million and whose common stock is traded on the NASDAQ stock market as "MFNC." The principal subsidiary of the Corporation is mBank. Headquartered in Manistique, Michigan, mBank has 10 branch locations; six in the Upper Peninsula, three in the Northern Lower Peninsula and one in Oakland County, Michigan. The Company's banking services include commercial lending and treasury management products and services geared toward small to mid-sized businesses, as well as a full array of personal and business deposit products and consumer loans. Forward-Looking Statements This release contains certain forward-looking statements. Words such as "anticipates," "believes," "estimates," "expects," "intends," "should," "will," and variations of such words and similar expressions are intended to identify forward-looking statements: as defined by the Private Securities Litigation Reform Act of 1995. These statements reflect management's current beliefs as to expected outcomes of future events and are not guarantees of future performance. These statements involve certain risks, uncertainties and assumptions that are difficult to predict with regard to timing, extent, likelihood, and degree of occurrence. Therefore, actual results and outcomes may materially differ from what may be expressed or forecasted in such forward-looking statements. Factors that could cause a difference include among others: changes in the national and local economies or market conditions; changes in interest rates and banking regulations; the impact of competition from traditional or new sources; and the possibility that anticipated cost savings and revenue enhancements from mergers and acquisitions, bank consolidations, branch closings and other sources may not be fully realized at all or within specified time frames as well as other risks and uncertainties including but not limited to those detailed from time to time in filings of the Company with the Securities and Exchange Commission. These and other factors may cause decisions and actual results to differ materially from current expectations. Mackinac Financial Corporation undertakes no obligation to revise, update, or clarify forward-looking statements to reflect events or conditions after the date of this release.
MACKINAC FINANCIAL CORPORATION AND SUBSIDIARIES
SELECTED FINANCIAL HIGHLIGHTS
For The Years Ended
December 31,
(Dollars in thousands, except per share data) 2009 2008
------------ ------------
(Unaudited) (Unaudited)
Selected Financial Condition Data (at end of
period):
Assets $ 515,377 $ 451,431
Loans 384,310 370,280
Investment securities 46,513 47,490
Deposits 421,389 371,097
Borrowings 36,140 36,210
Shareholders' equity 55,299 41,552
Selected Statements of Income Data:
Net interest income $ 16,287 $ 12,864
Income before taxes and preferred dividend 3,535 2,659
Net income 1,907 1,872
Income per common share - Basic .56 .55
Income per common share - Diluted .56 .55
Weighted average shares outstanding 3,419,736 3,422,012
Selected Financial Ratios and Other Data:
Performance Ratios:
Net interest margin 3.59% 3.23%
Efficiency ratio 73.37 85.51
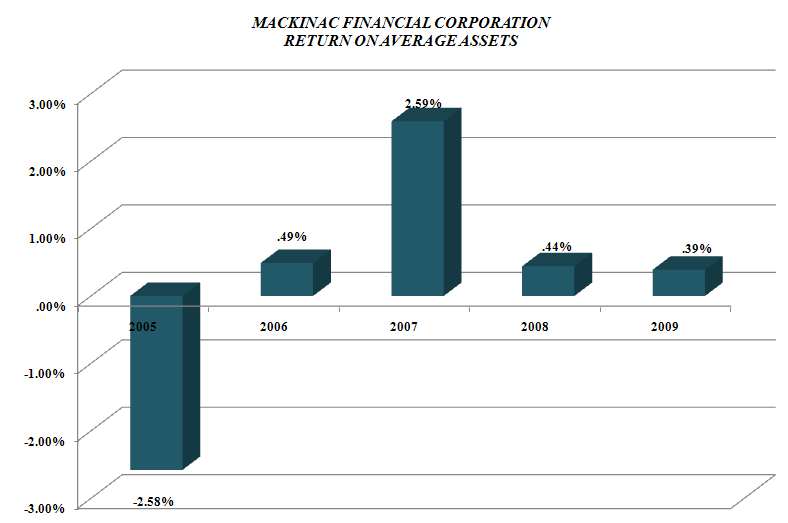
Return on average assets .39 .44
Return on average equity 3.77 4.61
Average total assets $ 493,652 $ 425,343
Average total shareholders' equity 50,531 40,630
Average loans to average deposits ratio 92.99% 105.61%
Common Share Data at end of period:
Market price per common share $ 4.64 $ 4.40
Book value per common share $ 13.10 $ 12.15
Common shares outstanding 3,419,736 3,419,736
Other Data at end of period:
Allowance for loan losses $ 5,225 $ 4,277
Non-performing assets $ 21,041 $ 7,076
Allowance for loan losses to total loans 1.36% 1.16%
Non-performing assets to total assets 4.08% 1.57%
Number of:
Branch locations 10 12
FTE Employees 100 100
MACKINAC FINANCIAL CORPORATION AND SUBSIDIARIES
CONSOLIDATED BALANCE SHEETS
December 31, December 31,
(Dollars in thousands) 2009 2008
------------- -------------
(unaudited) (audited)
ASSETS
Cash and due from banks $ 18,433 $ 10,112
Federal funds sold 27,000 -
------------- -------------
Cash and cash equivalents 45,433 10,112
Interest-bearing deposits in other financial
institutions 678 582
Securities available for sale 46,513 47,490
Federal Home Loan Bank stock 3,794 3,794
Loans:
Commercial 305,670 296,088
Mortgage 74,350 70,447
Installment 4,290 3,745
------------- -------------
Total Loans 384,310 370,280
Allowance for loan losses (5,225) (4,277)
------------- -------------
Net loans 379,085 366,003
Premises and equipment 10,165 11,189
Other real estate held for sale 5,804 2,189
Other assets 23,905 10,072
------------- -------------
TOTAL ASSETS $ 515,377 $ 451,431
============= =============
LIABILITIES AND SHAREHOLDERS' EQUITY
Liabilities:
Non-interest-bearing deposits $ 35,878 $ 30,099
Interest-bearing deposits:
NOW, Money Market, Checking 95,790 70,584
Savings 18,207 20,730
CDs < $100,000 59,953 73,752
CDs > $100,000 36,385 25,044
Brokered 175,176 150,888
------------- -------------
Total deposits 421,389 371,097
Borrowings:
Federal funds purchased - -
Short-term 15,000 -
Long-term 21,140 36,210
------------- -------------
Total borrowings 36,140 36,210
Other liabilities 2,549 2,572
------------- -------------
Total liabilities 460,078 409,879
Shareholders' equity:
Preferred stock - No par value:
Authorized 500,000 shares, no shares
outstanding 10,514 -
Common stock and additional paid in
capital - No par value
Authorized - 18,000,000 shares
Issued and outstanding - 3,419,736
shares 43,494 42,815
Accumulated deficit 198 (1,708)
Accumulated other comprehensive income
(loss) 1,093 445
------------- -------------
Total shareholders' equity 55,299 41,552
------------- -------------
TOTAL LIABILITIES AND SHAREHOLDERS' EQUITY $ 515,377 $ 451,431
============= =============
MACKINAC FINANCIAL CORPORATION AND SUBSIDIARIES
CONSOLIDATED STATEMENTS OF OPERATIONS
(Dollars in thousands, except per
share data) For The Years Ended December 31,
2009 2008 2007
----------- ----------- ----------
INTEREST INCOME: (unaudited) (audited) (audited)
Interest and fees on loans:
Taxable $ 20,521 $ 22,555 $ 26,340
Tax-exempt 292 404 533
Interest on securities:
Taxable 2,783 1,293 1,100
Tax-exempt 19 5 -
Other interest income 93 305 722
----------- ----------- ----------
Total interest income 23,708 24,562 28,695
----------- ----------- ----------
INTEREST EXPENSE:
Deposits 6,431 10,115 13,224
Borrowings 990 1,583 2,054
----------- ----------- ----------
Total interest expense 7,421 11,698 15,278
----------- ----------- ----------
Net interest income 16,287 12,864 13,417
Provision for loan losses 3,700 2,300 400
----------- ----------- ----------
Net interest income after provision
for loan losses 12,587 10,564 13,017
----------- ----------- ----------
OTHER INCOME:
Service fees 1,023 838 688
Net security gains 1,471 64 (1)
Net gains on sale of secondary
market loans 830 120 498
Proceeds from settlement of
lawsuits - 3,475 470
Other 1,427 156 351
----------- ----------- ----------
Total other income 4,751 4,653 2,006
----------- ----------- ----------
OTHER EXPENSES:
Salaries and employee benefits 6,583 6,886 6,757
Occupancy 1,385 1,374 1,272
Furniture and equipment 805 771 678
Data processing 862 844 785
Professional service fees 603 508 532
Loan and deposit 1,772 569 285
Telephone 187 170 228
Advertising 322 305 370
Other 1,283 1,131 1,193
----------- ----------- ----------
Total other expenses 13,802 12,558 12,100
----------- ----------- ----------
Income before provision for income
taxes 3,536 2,659 2,923
Provision for (benefit of) income
taxes 1,120 787 (7,240)
----------- ----------- ----------
----------- ----------- ----------
NET INCOME $ 2,416 $ 1,872 $ 10,163
----------- ----------- ----------
Preferred dividend expense 509 - -
----------- ----------- ----------
NET INCOME AVAILABLE TO COMMON
SHAREHOLDERS $ 1,907 $ 1,872 $ 10,163
=========== =========== ==========
INCOME PER COMMON SHARE
Basic $ .56 $ .55 $ 2.96
=========== =========== ==========
Diluted $ .56 $ .55 $ 2.96
=========== =========== ==========
MACKINAC FINANCIAL CORPORATION AND SUBSIDIARIES
LOAN PORTFOLIO AND CREDIT QUALITY
(Dollars in thousands)
Loan Portfolio Balances (at end of period):
December 31, December 31,
2009 2008
------------- -------------
(unaudited) (unaudited)
Commercial Loans:
Real estate - operators of nonresidential
buildings $ 48,689 $ 41,299
Hospitality and tourism 45,315 35,086
Real estate agents and managers 24,242 29,292
Operators of nonresidential buildings 12,619 13,467
Other 150,214 145,831
------------- -------------
Total Commercial Loans 281,079 264,975
1-4 family residential real estate 67,232 65,595
Consumer 4,290 3,745
Construction
Commercial 24,591 31,113
Consumer 7,118 4,852
------------- -------------
Total Loans $ 384,310 $ 370,280
============= =============
Credit Quality (at end of period):
December 31, December 31,
2009 2008
------------ ------------
(unaudited) (unaudited)
Nonperforming Assets :
Nonaccrual loans $ 14,368 $ 4,887
Loans past due 90 days or more - -
Restructured loans 869
------------ ------------
Total nonperforming loans 15,237 4,887
Other real estate owned 5,804 2,189
------------ ------------
Total nonperforming assets $ 21,041 $ 7,076
============ ============
Nonperforming loans as a % of loans 3.96% 1.32%
------------ ------------
Nonperforming assets as a % of assets 4.08% 1.57%
------------ ------------
Reserve for Loan Losses:
At period end $ 5,225 $ 4,277
------------ ------------
As a % of average loans 1.39% 1.18%
------------ ------------
As a % of nonperforming loans 34.29% 87.52%
------------ ------------
As a % of nonaccrual loans 36.37% 87.52%
============ ============
Charge-off Information (year to date):
Average loans $ 374,796 $ 361,324
------------ ------------
Net charge-offs $ 2,752 $ 2,169
------------ ------------
Charge-offs as a % of average loans .73% .60%
------------ ------------
MACKINAC FINANCIAL CORPORATION AND SUBSIDIARIES
QUARTERLY FINANCIAL HIGHLIGHTS
QUARTER ENDED
-----------------------------------------------------
(Unaudited)
-----------------------------------------------------
December September June March December
31, 30, 30, 31, 31,
2009 2009 2009 2009 2008
--------- --------- --------- --------- ----------
BALANCE SHEET
(Dollars in
thousands)
Total loans $ 384,310 $ 384,100 $ 372,004 $ 370,776 $ 370,280
Allowance for loan
losses (5,225) (4,081) (4,119) (4,793) (4,277)
--------- --------- --------- --------- ----------
Total loans, net 379,085 380,019 367,885 365,983 366,003
Intangible assets - - 6 26 46
Total assets 515,377 513,180 506,304 466,375 451,431
Core deposits 209,828 200,541 202,892 196,860 195,165
Noncore
deposits (1) 211,561 218,040 210,260 188,897 175,932
--------- --------- --------- --------- ----------
Total deposits 421,389 418,581 413,152 385,757 371,097
Total borrowings 36,140 36,140 36,210 36,210 36,210
Total shareholders'
equity 55,299 55,766 53,939 41,864 41,552
Total shares
outstanding 3,419,736 3,419,736 3,419,736 3,419,736 3,419,736
AVERAGE BALANCES
(Dollars in
thousands)
Assets $ 514,102 $ 513,687 $ 491,205 $ 454,740 $ 441,583
Loans 386,203 370,310 371,609 370,943 366,077
Deposits 418,280 419,102 401,510 372,669 358,213
Equity 55,665 54,594 49,855 41,813 41,516
INCOME STATEMENT
(Dollars in
thousands)
Net interest
income $ 4,431 $ 4,310 $ 4,051 $ 3,495 $ 3,330
Provision for loan
losses 2,300 700 150 550 1,100
--------- --------- --------- --------- ----------
Net interest
income after
provision 2,131 3,610 3,901 2,945 2,230
Total noninterest
income 1,503 2,418 439 391 308
Total noninterest
expense 3,650 3,443 3,470 3,239 2,961
--------- --------- --------- --------- ----------
Income before taxes (16) 2,585 870 97 (423)
Provision for
income taxes (22) 864 271 7 (171)
--------- --------- --------- --------- ----------
Net income 6 1,721 599 90 (252)
--------- --------- --------- --------- ----------
Preferred dividend
expense 186 185 138 - -
--------- --------- --------- --------- ----------
Net income
available to
common
shareholders $ (180) $ 1,536 $ 461 $ 90 $ (252)
========= ========= ========= ========= ==========
PER SHARE DATA
Earnings $ (.05) $ .45 $ .13 $ .03 $ (.07)
Book value per
common share 13.10 13.25 12.73 12.24 12.15
Market value,
closing price 4.64 4.10 4.50 4.00 4.40
ASSET QUALITY
RATIOS
Nonperforming
loans/total loans 3.96% 3.00% 2.66% 3.52% 1.32%
Nonperforming
assets/total
assets 4.08 3.38 2.93 3.27 1.57
Allowance for loan
losses/total loans 1.36 1.06 1.11 1.29 1.16
Allowance for loan
losses/nonperform-
ing loans 34.29 35.40 41.71 36.72 87.52
PROFITABILITY
RATIOS
Return on average
assets (.14)% 1.19% .38% .08% (.23)%
Return on average
equity (1.28) 11.16 3.71 .87 (2.42)
Net interest margin 3.74 3.66 3.58 3.35 3.20
Efficiency ratio 71.03 70.09 76.55 82.36 80.30
Average
loans/average
deposits 92.33 88.36 92.55 99.54 102.20
CAPITAL ADEQUACY
RATIOS
Tier 1 leverage
ratio 9.75% 9.74% 9.65% 7.86% 8.01%
Tier 1 capital to
risk weighted
assets 11.92 12.18 11.94 9.31 9.25
Total capital to
risk weighted
assets 13.17 13.19 13.00 10.56 10.38
Average
equity/average
assets 10.83 10.63 10.15 9.19 9.40
Tangible
equity/tangible
assets 10.83 10.87 10.65 8.97 9.20
(1) Noncore deposits includes Internet CDs, brokered deposits and CDs
greater than $100,000
Contact Information: Contact: Investor Relations (888) 343-8147 Website: www.bankmbank.com