TORONTO, ONTARIO--(Marketwire - May 1, 2012) -
(All amounts are expressed in United States dollars, unless stated otherwise)
Alamos Gold Inc. (TSX:AGI) ("Alamos" or the "Company") reports operating and financial results for the first quarter of 2012 and provides a review of its operations, exploration and development activities.
This press release should be read in conjunction with the Company's interim consolidated financial statements for the three-month periods ended March 31, 2012 and March 31, 2011 and associated Management's Discussion and Analysis ("MD&A"), which are available from the Company's website, www.alamosgold.com, in the "Investor Centre" tab in the "Reports and Financial Statements" section, and on SEDAR (www.sedar.com).
First Quarter 2012 Highlights
In the first quarter of 2012, the Company:
- Completed construction and commissioning of the gravity mill to process high-grade ore from the Escondida zone in March, which will add significantly to production throughout the remainder of the year.
- Produced 40,500 ounces of gold, including 17,000 ounces in March, at a cash operating cost of $360 per ounce of gold sold (total cash costs inclusive of royalties were $442 per ounce of gold sold).
- Generated record cash from operating activities before changes in non-cash working capital of $44.9 million ($0.38 per basic share). After changes in non-cash working capital, the Company generated quarterly cash from operating activities of $36.1 million ($0.30 per basic share).
- Recognized record quarterly earnings of $29.5 million ($0.25 per basic share).
- Sold 41,745 ounces of gold for revenues of $70.3 million.
- Reported encouraging drill results at El Victor North with the potential to expand reserves along the northern boundary of the Gap to El Victor trend.
- Increased its semi-annual dividend 43% from $0.07 per share to $0.10 per share, representing a 233% increase since the first semi-annual dividend was declared in the first quarter of 2010.
- Reported updated mineral reserves and resources for its Mexican and Turkish projects, maintaining a nine-year mineral reserve life at the Mulatos Mine and increasing measured and indicated mineral resources in Turkey (excluding Çamyurt) to over 2.2 million ounces.
Subsequent to quarter-end, the Company:
- Achieved average crusher throughput of 18,000 tonnes per day ("tpd") to-date in the second quarter.
First Quarter 2012 Financial Results
The Company generated record cash from operating activities in the first quarter of 2012 as a result of higher realized gold prices and continued low cash costs. Cash from operating activities before changes in non-cash working capital in the first quarter of $44.9 million ($0.38 per basic share) was 66% higher than $27.0 million ($0.23 per basic share) generated in the first quarter of 2011. Cash from operating activities after changes in non-cash working capital in the first quarter of 2012 of $36.1 million ($0.30 per basic share) increased 23% relative to the same period of 2011.
Earnings before income taxes in the first quarter of 2012 were $39.5 million or $0.33 per basic share, compared to $25.4 million or $0.22 per basic share in the first quarter of 2011. On an after-tax basis, earnings in the first quarter of 2012 of $29.5 million or $0.25 per basic share increased 65% over the comparable period of 2011. Earnings in the first quarter were positively impacted by a favourable effective tax rate, resulting from a $1.9 million net foreign exchange gain on revaluation of the Company's Mexican peso-denominated deferred tax liability.
Capital expenditures in the first quarter of 2012 totalled $16.2 million. Investments in operating capital and development activities for the Company's Mexican operations were $5.7 million and $7.5 million, respectively. In addition, the Company capitalized $3.0 million in exploration and development activities for its Turkish projects.
Key financial highlights for the first quarter of 2012 compared to the first quarter of 2011 are presented at the end of this release in Table 1. The unaudited interim consolidated statements of financial position, comprehensive income, and cash flows as at and for the three months ended March 31, 2012 and 2011 are presented at the end of this release in Table 2.
First Quarter 2012 Operating Results
Gold production in the first quarter of 2012 of 40,500 ounces was 8% higher than production of 37,500 ounces in the first quarter of 2011. The increase in the first quarter of 2012 from the same period last year was attributable to a 17% increase in crusher throughput and the start up of the high-grade mill in March of 2012, offset by a decrease in the recovery ratio1 and lower grades mined.
Construction of the gravity mill to process high-grade ore from Escondida was completed in early 2012 and commissioning and training was ongoing throughout the first quarter. The mill was started in late January and operated at budgeted throughput levels of 500 tpd throughout the month of March.
While completing development of the Escondida zone, the Company encountered mineralization in the halo area surrounding the high grade deposit that had been modeled as waste. This material was economic to process and therefore was classified as ore and either stacked directly on the leach pad (low grade, generally 3 grams of gold per tonne of ore ("g/t Au") or lower) or processed through the mill (higher grade) during the commissioning period of the gravity mill. As a result of processing the halo area material in the first quarter, the grade of ore processed through the mill of 10.17 g/t Au was lower than budget, and is not indicative of the grade of the actual Escondida high grade mineral reserve. The Company expects to be able to provide a reconciliation of the actual realized grade at Escondida to the block model at the end of the second quarter of 2012. The Company expects to benefit from a full quarter of high-grade mill production in the second quarter.
1 "recovery ratio" is defined as the ratio of gold ounces produced divided by the number of contained ounces stacked over a specific period
Cash operating costs of $360 per ounce of gold sold in the first quarter of 2012 were below the low end of the Company's guidance of $365 to $390 per ounce, but were 3% higher than $349 per ounce in the same period in 2011. The year-over-year increase is primarily attributable to increases in input costs, including labour, cyanide and diesel. Including the 5% royalty, total cash costs were $442 per ounce of gold sold in the first quarter.
The recovery ratio in the first quarter of 2012 was 77%, consistent with the Company's budgeted annual recovery ratio of 77%.
Crusher throughput in the first quarter of 2012 averaged 13,900 tpd, 17% higher than 11,900 tpd in the same period of last year but below the annual average budgeted rate of 17,500 tpd. During the months of January and February, the Company completed an overhaul of its crushing circuit, replacing the primary, rebuilding the secondary and re-configuring the tertiary crushing circuit. This work required approximately 8 days of scheduled downtime. Crusher throughput increased sharply in the latter half of the first quarter, averaging 17,000 tpd in the month of March, and subsequently achieving new record levels, averaging 18,000 tpd in the month of April. Higher crusher throughput has been achieved without sacrificing size quality. The size of crushed ore stacked on the leach pad was consistent with budgeted levels, with 91% passing 3/8th's of an inch in the first quarter of 2012.
Key operational metrics and production statistics for the first quarter 2012 compared to the same period of 2011 are presented in Table 3 at the end of this press release.
First Quarter 2012 Exploration Update
Mexico
The Company completed 16,800 m of drilling in 95 holes to-date in 2012, with exploration activities focused on El Victor North and East Estrella.
El Victor North
The El Victor North area contains silica alteration identical to the El Victor deposit and is a northwestern extension of El Victor mineral reserve. El Victor North has the potential to expand mineral reserves along the northern boundary of the Gap to El Victor trend. All holes drilled to-date have encountered significant intervals of favourable silicic or advanced argillic alteration, and are expected to extend the El Victor pit north and west of the current pit design outline.
Total exploration spending at El Victor North in the first quarter of 2012 was $1.1 million with a total of 11,600 metres in 72 holes drilled, bringing the cumulative total to over 200 holes for the current drill program. Ore-grade mineralization has been extended up to 250 m to the north over a strike length of 500 m directly adjacent to the El Victor mineral reserve. Wide intervals of low-grade mineralization with local high-grade intercepts have also been encountered. The majority of thick low-grade intercepts are hosted by advanced argillic alteration, with high-grade in vuggy silica zones. Infill drilling is in progress to bring mineralization to the measured and indicated category. New intercepts from drilling include:
- 1.54 g/t Au over 79.3 metres (12EV227)
- 1.20 g/t Au over 51.8 meters (12EV227)
Relevant assay results from the recent reverse circulation ("RC") drilling at El Victor are presented in Table 4 at the end of this press release.
East Estrella
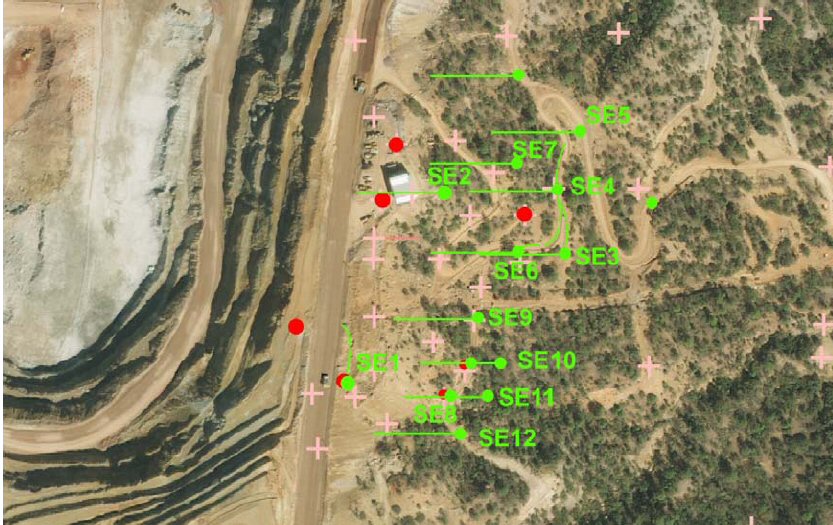
Exploration drilling directly east of the Mulatos pit southeast wall began in late March after a detailed evaluation of previous drill hole data (Figure 1). Condemnation for a waste dump site east of the Estrella Pit by Placer Dome in 1996 encountered a number of near-surface intercepts (for example, 21.3 m of 4.4 g/t Au) in the area. The Company followed up on the intercepts in 2004 with a limited drilling program consisting of northeast-oriented angle holes, assuming a northwest-trending, southwest dipping structural control. Results were mixed and ambiguous, indicating discontinuous mineralization. The program was discontinued due to higher priorities at other projects.
Review of drill data on newly generated sections and a review of the pit walls suggest that the mineralization may be controlled by primarily north-south structures. Resource expansion potential exists in the area, therefore a 21-hole drill program has been designed to drill test the area on roughly 50 m centres, which will be completed in 2012.
Relevant assay results from the recent RC drilling at East Estrella are presented in Table 5 at the end of this press release.
Exploration - Turkey
Exploration expenditures in Turkey in the first quarter of 2012 totalled $1.5 million. A total of four drill rigs were active throughout the quarter drilling a total of 33 holes (3,300 m). Since the Company acquired its Turkish projects in early 2010, a total of 54,500 m of drilling has been completed. In March 2012, the Company acquired additional mineral concessions adjacent to Agi Dagi and Kirazli, doubling its existing land package.
Drilling in the first quarter of 2012 focused on geotechnical and hydrological drilling to support the pre-feasibility study, as well as extension drilling of known zones of mineralization at Agi Dagi and Kirazli. The Company provided an updated mineral resource estimate for the Agi Dagi and Kirazli deposits in March of 2012, and expects to release an initial mineral resource for the Çamyurt project shortly. As of December 31, 2011, approximately 2.2 million ounces of gold and 16.9 million ounces of silver had been defined as measured and indicated resources at the Agi Dagi and Kirazli deposits.
Firetower
The Firetower project is located adjacent to the Baba deposit, and gold mineralization extends more than 880 meters to the northeast, towards the Deli deposit, and is part of the Agi Dagi resource area. Two drill rigs have operated on the project in 2012, drilling 1,600 metres in six drill holes. A portion of the Firetower mineral resource area was included in the Company's year-end 2011 mineral reserve and resource statement.
Outlook
The Company delivered excellent financial results in the first quarter of 2012, generating record earnings and cash flows. Strong cash flows from operations enabled the Company to increase its semi-annual dividend to $0.10 per share in the first quarter.
Mine operations are currently benefiting from the capital projects that were initiated in 2011 and completed in the first quarter of this year. The crushing circuit overhaul, completed in January and early February, has enabled crusher throughput to reach record levels, averaging 18,000 tpd to-date in the second quarter. In addition, the gravity mill to process high-grade ore from Escondida is currently operating at 500 tonnes per day and is expected to contribute 67,000 ounces of production in 2012 at a budgeted grade of 13.4 g/t Au. Based on bulk sample testing conducted in 2007, the Company believes that there is the potential for higher production from the Escondida zone through the realization of positive grade reconciliation relative to the drill-indicated reserve grade. Given that the gravity mill only began processing high grade ore from the Escondida zone late in the first quarter, the Company expects that it will be able to provide an indication of the grades mined at Escondida at the end of the second quarter of 2012.
Production from the gravity mill is expected to enable the Company to achieve its full year 2012 production guidance of between 200,000 and 220,000 ounces of gold at a cash operating cost of $365 to $390 per ounce of gold sold, exclusive of the 5% royalty.
The Mulatos Mine is expected produce its one millionth ounce of gold in 2012. The Company's mineral reserve and resource update released in the first quarter confirmed that the life of the Mulatos Mine remains unchanged at nine years. Exploration success at Mulatos has resulted in replacing mined mineral reserves at Mulatos each year since the start of production in 2005.
The mineral reserve and resource update released in the first quarter demonstrated the level of exploration success the Company has achieved at its Agi Dagi and Kirazli projects in northwestern Turkey. Measured and indicated mineral resources have more than doubled since the Company acquired the projects in early 2010. In addition, the discovery of the Çamyurt zone is expected to further increase resources and to materially contribute to the Company's production profile in Turkey. An initial mineral resource estimate for Çamyurt is expected to be released shortly.
Throughout 2012, activities in Turkey will be focused on completing the preliminary feasibility study in the second quarter, securing EIA approvals in the third quarter and the commencement of construction activities in the fourth quarter of 2012. The preliminary feasibility study will incorporate the additional resources and accommodate the increased scope of the projects since the acquisition. The Company believes that the revised combined production profile of Agi Dagi and Kirazli could result in annual production rates in Turkey that are substantially higher than initially reported in the March 2010 Scoping Study.
Exploration activities in 2012 are expected to continue to expand resources in both Mexico and Turkey. In Mexico, the focus will be on step-out drilling at San Carlos and expansion of the mineralized zone at El Victor North, in addition to the initiation of underground development for exploration drilling. In addition to the drill programs outlined above, the Company also has a large reconnaissance-level exploration program planned for 2012 to assess several of its regional grassroots targets. In Turkey, drilling activities in the second quarter of 2012 will focus on engineering activities to support the project development plan. Infill and expansion drilling at Çamyurt will continue, in addition to drill programs at the highly prospective Rockpile target.
The Company continues to strengthen its financial position: debt-free with over $260 million in cash and short-term investments at April 26, 2012 and continued strong cash flows from operations. This financial strength will continue to allow the Company to finance its immediate capital, development and exploration plans, as well as provide significant funding for development of additional projects through internal growth or acquisitions.
Reminder of First Quarter 2012 Results Conference Call
The Company's senior management will host a conference call on Tuesday, May 1, 2012 at 12:00 pm ET to discuss the first quarter 2012 results, and to provide an update of the Company's operating, exploration, and development activities.
Participants may join the conference call by dialling 1 (866) 226-1792 or 1 (416) 340-2216 for calls outside Canada and the United States or via webcast on the Company's website at www.alamosgold.com.
A recorded playback of the conference call can be accessed after the event until May 15, 2012 by dialling 1 (800) 408-3053 or 1 (905) 694-9451 for calls outside Canada and the United States. The pass code for the conference call playback is 5252443. The archived audio webcast will also be available on the Company's website at www.alamosgold.com.
QA/QC Programs
Agi Dagi, Kirazli and Çamyurt exploration programs were conducted under the supervision of Charles Tarnocai, PhD in Geology, Alamos' Vice President of Exploration and Corporate Development, a Qualified Person as defined by National Instrument 43-101 of the Canadian Securities Administrators. Strict sampling and QA/QC protocol are followed, including the insertion of standards, blanks, and duplicates on a regular basis. Sample intervals are usually 1.0 to 1.5 m. Agi Dagi, Kirazli and Çamyurt samples are sent to Acme Analytical Laboratories in Ankara, Turkey for sample preparation and then to Vancouver, British Columbia, Canada or Santiago, Chile for analysis. Analytical method is fire assay with atomic adsorption finish and gravimetric finish for individual samples with a gold concentration greater than 3.0 g/t Au.
Mulatos exploration programs are conducted under the supervision of Ken Balleweg, B.Sc. Geological Engineering, M.Sc. Geology, Registered Professional Geologist, Alamos' Mexico Exploration Manager. Mr. Balleweg is a Qualified Person as defined by National Instrument 43-101 of the Canadian Securities Administrators. Strict sampling and QA/QC protocol are followed, including the insertion of standards, blanks, and duplicates on a regular basis. Sample intervals are usually 0.5 to 1.5 m. Mulatos samples are sent to ALS Chemex Inc. in Hermosillo, Mexico for sample preparation and then to Vancouver, British Columbia, Canada for analysis. Analytical method is fire assay with atomic adsorption finish and gravimetric finish for individual samples with a gold concentration greater than 5.0 g/t Au.
About Alamos
Alamos is an established Canadian-based gold producer that owns and operates the Mulatos Mine in Mexico, and has exploration and development activities in Mexico and Turkey. The Company employs nearly 500 people in Mexico and Turkey and is committed to the highest standards of environmental management, social responsibility, and health and safety for its employees and neighbouring communities. Alamos has over $260 million cash and short-term investments, is debt-free, and unhedged to the price of gold. As of April 30, 2012, Alamos had 119,502,808 common shares outstanding (124,743,708 shares fully diluted), which are traded on the Toronto Stock Exchange under the symbol "AGI".
Cautionary Non-GAAP Measures and Additional GAAP Measures
Note that for purposes of this section, GAAP refers to IFRS. The Company believes that investors use certain Non-GAAP and additional GAAP measures as indicators to assess gold mining companies. They are intended to provide additional information and should not be considered in isolation or as a substitute for measures of performance prepared with GAAP.
Additional GAAP measures which are presented on the face of the Company's consolidated statements of comprehensive income include "Mine operating costs", "Earnings from mine operations" and "Earnings from operations". These measures are intended to provide an indication of the Company's mine and operating performance. "Cash flow from operating activities before changes in non-cash working capital" is a non-GAAP performance measure which could provide an indication of the Company's ability to generate cash flows from operations, and is calculated by adding back the change in non-cash working capital to "Cash provided by (used in) operating activities" as presented on the Company's consolidated statements of cash flows. "Mining cost per tonne of ore" and "Cost per tonne of ore" are Non-GAAP performance measures which could provide an indication of the mining and processing efficiency and effectiveness of the Mine. These measures are calculated by dividing the relevant mining and processing costs and total costs by the tonnes of ore processed in the period. "Cost per tonne of ore" is usually affected by operating efficiencies and waste-to-ore ratios in the period. "Cash operating costs per ounce" and "total cash costs per ounce" as used in this analysis are Non-GAAP terms typically used by gold mining companies to assess the level of gross margin available to the Company by subtracting these costs from the unit price realized during the period. These Non-GAAP terms are also used to assess the ability of a mining company to generate cash flow from operations. There may be some variation in the method of computation of "cash operating costs per ounce" as determined by the Company compared with other mining companies. In this context, "cash operating costs per ounce" reflects the cash operating costs allocated from in-process and dore inventory associated with ounces of gold sold in the period. "Cash operating costs per ounce" may vary from one period to another due to operating efficiencies, waste-to-ore ratios, grade of ore processed and gold recovery rates in the period. "Total cash costs per ounce" includes "cash operating costs per ounce" plus applicable royalties. Cash operating costs per ounce and total cash costs per ounce are exclusive of exploration costs. Non-GAAP and additional GAAP measures do not have a standardized meaning prescribed under IFRS and therefore may not be comparable to similar measures presented by other companies.
Cautionary Note
This News Release includes certain "forward-looking statements". All statements other than statements of historical fact included in this release, including without limitation statements regarding forecast gold production, gold grades, recoveries, waste-to-ore ratios, total cash costs, potential mineralization and reserves, exploration results, and future plans and objectives of Alamos, are forward-looking statements that involve various risks and uncertainties. These forward-looking statements include, but are not limited to, statements with respect to mining and processing of mined ore, achieving projected recovery rates, anticipated production rates and mine life, operating efficiencies, costs and expenditures, changes in mineral resources and conversion of mineral resources to proven and probable reserves, and other information that is based on forecasts of future operational or financial results, estimates of amounts not yet determinable and assumptions of management.
Exploration results that include geophysics, sampling, and drill results on wide spacings may not be indicative of the occurrence of a mineral deposit. Such results do not provide assurance that further work will establish sufficient grade, continuity, metallurgical characteristics and economic potential to be classed as a category of mineral resource. A mineral resource which is classified as "inferred" or "indicated" has a great amount of uncertainty as to its existence and economic and legal feasibility. It cannot be assumed that any or part of an "indicated mineral resource" or "inferred mineral resource" will ever be upgraded to a higher category of resource. Investors are cautioned not to assume that all or any part of mineral deposits in these categories will ever be converted into proven and probable reserves.
Any statements that express or involve discussions with respect to predictions, expectations, beliefs, plans, projections, objectives, assumptions or future events or performance (often, but not always, using words or phrases such as "expects" or "does not expect", "is expected", "anticipates" or "does not anticipate", "plans", "estimates" or "intends", or stating that certain actions, events or results "may", "could", "would", "might" or "will" be taken, occur or be achieved) are not statements of historical fact and may be "forward-looking statements." Forward-looking statements are subject to a variety of risks and uncertainties which could cause actual events or results to differ from those reflected in the forward-looking statements.
There can be no assurance that forward-looking statements will prove to be accurate and actual results and future events could differ materially from those anticipated in such statements. Important factors that could cause actual results to differ materially from Alamos' expectations include, among others, risks related to international operations, the actual results of current exploration activities, conclusions of economic evaluations and changes in project parameters as plans continue to be refined as well as future prices of gold and silver, as well as those factors discussed in the section entitled "Risk Factors" in Alamos' Annual Information Form. Although Alamos has attempted to identify important factors that could cause actual results to differ materially, there may be other factors that cause results not to be as anticipated, estimated or intended. There can be no assurance that such statements will prove to be accurate as actual results and future events could differ materially from those anticipated in such statements. Accordingly, readers should not place undue reliance on forward-looking statements.
| Table 1: Financial Highlights | ||||||||
| Q1 2012 |
Q1 2011 |
|||||||
| Cash provided by operating activities before changes in non-cash | $ | 44,928 | $ | 27,006 | ||||
| working capital (000)(1) | ||||||||
| Changes in non-cash working capital (000) | $ | (8,846 | ) | $ | 2,369 | |||
| Cash provided by operating activities (000) | $ | 36,082 | $ | 29,375 | ||||
| Earnings before income taxes for the period (000) | $ | 39,462 | $ | 25,442 | ||||
| Earnings for the period (000) | $ | 29,470 | $ | 17,857 | ||||
| Earnings per share | ||||||||
| - basic | $ | 0.25 | $ | 0.15 | ||||
| - diluted | $ | 0.24 | $ | 0.15 | ||||
| Comprehensive income for the period (000) | $ | 29,298 | $ | 15,757 | ||||
| Weighted average number of common shares outstanding | ||||||||
| - basic | 118,940,000 | 116,532,000 | ||||||
| - diluted | 120,355,000 | 118,142,000 | ||||||
| Assets (000) (2) | $ | 642,074 | $ | 599,224 | ||||
| (1) | A non-GAAP measure calculated as cash provided by operating activities as presented on the consolidated statements of cash flows and adding back changes in non-cash working capital. |
| (2) | Assets are shown as at March 31, 2012 and December 31, 2011. |
| Table 2: Unaudited Consolidated Statements of Financial Position, Comprehensive Income, and Cash Flows | |||||||
| ALAMOS GOLD INC. | |||||||
| Unaudited Consolidated Statements of Financial Position | |||||||
| (Stated in thousands of United States dollars) | |||||||
| March 31, | December 31, | ||||||
| 2012 | 2011 | ||||||
| Current Assets | |||||||
| Cash and cash equivalents | $ | 212,286 | $ | 169,471 | |||
| Short-term investments | 43,679 | 53,088 | |||||
| Amounts receivable | 7,124 | 6,147 | |||||
| Advances and prepaid expenses | 2,552 | 2,117 | |||||
| Available-for-sale securities | 7,548 | 10,355 | |||||
| Other financial assets | 208 | 244 | |||||
| Inventory | 36,784 | 33,220 | |||||
| Total Current Assets | 310,181 | 274,642 | |||||
| Non-Current Assets | |||||||
| Exploration and evaluation assets | 111,485 | 108,454 | |||||
| Mineral property, plant and equipment | 220,408 | 216,128 | |||||
| Total Assets | $ | 642,074 | $ | 599,224 | |||
| Current Liabilities | |||||||
| Accounts payable and accrued liabilities | $ | 19,390 | $ | 17,024 | |||
| Dividends payable | 11,935 | - | |||||
| Income taxes payable | - | 6,125 | |||||
| Current portion of other liabilities | 395 | 363 | |||||
| Total Current Liabilities | 31,720 | 23,512 | |||||
| Non-Current Liabilities | |||||||
| Deferred income taxes | 41,694 | 35,008 | |||||
| Decommissioning liability | 6,779 | 6,680 | |||||
| Other liabilities | 425 | 474 | |||||
| Total Liabilities | 80,618 | 65,674 | |||||
| Share capital | $ | 367,787 | $ | 355,524 | |||
| Contributed surplus | 26,141 | 27,861 | |||||
| Accumulated other comprehensive loss | (1,252 | ) | (1,080 | ) | |||
| Retained earnings | 168,780 | 151,245 | |||||
| Total Equity | 561,456 | 533,550 | |||||
| Total Liabilities and Equity | $ | 642,074 | $ | 599,224 | |||
| ALAMOS GOLD INC. | |||||||
| Unaudited Consolidated Statements of Comprehensive Income | |||||||
| For the three-months ended | |||||||
| (stated in thousands of United States dollars, except per share amounts) | |||||||
| March 31, | March 31, | ||||||
| 2012 | 2011 | ||||||
| Operating Revenues | $ | 70,256 | $ | 54,376 | |||
| MINE OPERATING COSTS | |||||||
| Mining and processing | 15,019 | 13,658 | |||||
| Royalties | 3,431 | 2,601 | |||||
| Amortization | 7,778 | 5,725 | |||||
| 26,228 | 21,984 | ||||||
| EARNINGS FROM MINE OPERATIONS | 44,028 | 32,392 | |||||
| EXPENSES | |||||||
| Exploration | 1,483 | 2,012 | |||||
| Corporate and administrative | 2,931 | 2,435 | |||||
| Share-based compensation | 2,567 | 2,700 | |||||
| 6,981 | 7,147 | ||||||
| EARNINGS FROM OPERATIONS | 37,047 | 25,245 | |||||
| OTHER INCOME (EXPENSES) | |||||||
| Finance income | 848 | 405 | |||||
| Financing expense | (133 | ) | (148 | ) | |||
| Foreign exchange gain | 1,199 | 1,058 | |||||
| Other income (loss) | 501 | (1,118 | ) | ||||
| EARNINGS BEFORE INCOME TAXES | 39,462 | 25,442 | |||||
| INCOME TAXES | |||||||
| Current tax expense | (3,306 | ) | (7,250 | ) | |||
| Deferred tax expense | (6,686 | ) | (335 | ) | |||
| EARNINGS FOR THE PERIOD | $ | 29,470 | $ | 17,857 | |||
| Other comprehensive income | |||||||
| - Unrealized loss on securities | (79 | ) | (2,100 | ) | |||
| - Reclassification of realized gains on available-for-sale securities included in earnings | (93 | ) | - | ||||
| COMPREHENSIVE INCOME | $ | 29,298 | $ | 15,757 | |||
| EARNINGS PER SHARE | |||||||
| - basic | $ | 0.25 | $ | 0.15 | |||
| - diluted | $ | 0.24 | $ | 0.15 | |||
| Weighted average number of common shares outstanding | |||||||
| - basic | 118,940,000 | 116,532,000 | |||||
| - diluted | 120,355,000 | 118,143,000 | |||||
| ALAMOS GOLD INC. | |||||||
| Unaudited Consolidated Statements of Cash Flows | |||||||
| For the three-months ended | |||||||
| (stated in thousands of United States dollars) | |||||||
| March 31, 2012 |
March 31, 2011 |
||||||
| CASH PROVIDED BY (USED IN): | |||||||
| OPERATING ACTIVITIES | |||||||
| Earnings for the period | $ | 29,470 | $ | 17,857 | |||
| Adjustments for items not involving cash: | |||||||
| Amortization | 7,778 | 5,725 | |||||
| Financing expense | 133 | 148 | |||||
| Unrealized foreign exchange (gain) loss | (1,258 | ) | (68 | ) | |||
| Deferred tax expense | 6,686 | 335 | |||||
| Share-based compensation | 2,567 | 2,700 | |||||
| Gain on sale of securities | (504 | ) | - | ||||
| Other | 56 | 309 | |||||
| Changes in non-cash working capital: | |||||||
| Fair value of forward contracts | - | 486 | |||||
| Amounts receivable | (6,286 | ) | (2,562 | ) | |||
| Inventory | (2,490 | ) | 710 | ||||
| Advances and prepaid expenses | (435 | ) | 1,317 | ||||
| Accounts payable, taxes payable and accrued liabilities | 365 | 2,418 | |||||
| 36,082 | 29,375 | ||||||
| INVESTING ACTIVITIES | |||||||
| Sale (purchases) of securities | 3,338 | (3,274 | ) | ||||
| Contractor advances | - | (5,530 | ) | ||||
| Short-term investments (net) | 9,409 | (4,715 | ) | ||||
| Proceeds on sale of equipment | - | 444 | |||||
| Decommissioning liability | (28 | ) | - | ||||
| Exploration and evaluation assets | (3,031 | ) | (1,586 | ) | |||
| Mineral property, plant and equipment | (13,183 | ) | (8,920 | ) | |||
| (3,495 | ) | (23,581 | ) | ||||
| FINANCING ACTIVITIES | |||||||
| Common shares issued | 9,143 | 3,194 | |||||
| 9,143 | 3,194 | ||||||
| Effect of exchange rates on cash and cash equivalents | 1,085 | 710 | |||||
| Net increase (decrease) in cash and cash equivalents | 42,815 | 9,698 | |||||
| Cash and cash equivalents - beginning of year | 169,471 | 146,334 | |||||
| CASH AND CASH EQUIVALENTS - END OF PERIOD | $ | 212,286 | $ | 156,032 | |||
| Supplemental information: | |||||||
| Interest paid | $ | - | $ | - | |||
| Interest received | $ | 485 | $ | 220 | |||
| Income taxes paid | $ | 5,856 | $ | 4,400 | |||
| Table 3: Production Summary & Statistics (1) | |||||||||||
| Production summary | Q1 2012 |
Q1 2011 |
Change (#) |
Change (%) |
|||||||
| Ounces produced (1) | 40,500 | 37,500 | 3,000 | 8 | % | ||||||
| Ore crushed (tonnes) - low grade | 1,239,000 | 1,069,000 | 170,000 | 16 | % | ||||||
| Grade (g/t Au) | 1.11 | 1.26 | (0.15 | ) | (12 | %) | |||||
| Contained ounces stacked | 44,200 | 43,300 | 900 | 2 | % | ||||||
| Ore crushed (tonnes) - high grade | 25,000 | - | 25,000 | N/A | |||||||
| Grade (g/t Au) | 10.17 | - | 10.17 | N/A | |||||||
| Contained ounces milled | 8,200 | - | 8,200 | N/A | |||||||
| Ratio of total ounces produced to contained | 77 | % | 87 | % | (10 | %) | (11 | %) | |||
| ounces stacked and milled | |||||||||||
| Total ore mined (tonnes) | 1,267,000 | 1,174,000 | 93,000 | 8 | % | ||||||
| Waste mined (tonnes) | 775,000 | 640,000 | 135,000 | 21 | % | ||||||
| Total mined (tonnes) | 2,042,000 | 1,814,000 | 228,000 | 13 | % | ||||||
| Waste-to-ore ratio | 0.61 | 0.55 | 0.06 | 11 | % | ||||||
| Ore crushed per day (tonnes) - combined | 13,900 | 11,900 | 2,000 | 17 | % | ||||||
| (1) | Reported gold production for Q1 2011 has been adjusted to reflect final refinery settlement. Reported gold production for Q1 2012 is subject to final refinery settlement and may be adjusted. |
| Table 4: El Victor - Select Composite Intervals - Reverse Circulation Drilling1 | |||||||||||
| Include intervals at >0.35 g/t Au over a 3 metres minimum width, no assay cut | |||||||||||
| DRILL HOLE |
DRILLING METHOD |
TOTAL DEPTH (m) |
FROM (m) |
TO (m) |
INT. (m) |
GOLD (g/t) |
|||||
| 12EV209 | RC | 132.62 | No | ||||||||
| Intervals | |||||||||||
| 27.44 | 30.49 | 3.05 | 0.462 | ||||||||
| 33.54 | 38.11 | 4.57 | 0.520 | ||||||||
| 12EV211 | RC | 199.70 | 48.78 | 71.65 | 22.87 | 0.988 | |||||
| 77.74 | 83.84 | 6.10 | 0.371 | ||||||||
| 88.41 | 109.76 | 21.35 | 1.191 | ||||||||
| 169.21 | 172.26 | 3.05 | 1.038 | ||||||||
| 12EV214 | RC | 199.70 | 64.02 | 86.89 | 22.87 | 0.678 | |||||
| 141.77 | 146.34 | 4.57 | 0.617 | ||||||||
| 12EV215 | RC | 105.18 | No | ||||||||
| Intervals | |||||||||||
| 12EV216 | RC | 121.95 | No | ||||||||
| Intervals | |||||||||||
| 12EV217 | RC | 152.44 | 41.16 | 44.21 | 3.05 | 0.634 | |||||
| 99.09 | 120.43 | 21.34 | 1.260 | ||||||||
| 12EV218 | RC | 152.44 | 94.51 | 105.18 | 10.67 | 1.266 | |||||
| 12EV219 | RC | 121.95 | No | ||||||||
| Intervals | |||||||||||
| 67.07 | 71.65 | 4.58 | 0.717 | ||||||||
| 12EV221 | RC | 121.95 | 83.84 | 86.89 | 3.05 | 1.067 | |||||
| 103.66 | 106.71 | 3.05 | 0.514 | ||||||||
| 79.27 | 82.32 | 3.05 | 0.364 | ||||||||
| 96.04 | 102.13 | 6.09 | 1.253 | ||||||||
| 105.18 | 111.28 | 6.10 | 1.738 | ||||||||
| 12EV222 | RC | 182.93 | 115.85 | 121.95 | 6.10 | 0.740 | |||||
| 140.24 | 143.29 | 3.05 | 0.566 | ||||||||
| 146.34 | 150.91 | 4.57 | 0.428 | ||||||||
| 155.49 | 164.63 | 9.14 | 0.899 | ||||||||
| 12EV223 | RC | 243.90 | No | ||||||||
| Intervals | |||||||||||
| 12EV224 | RC | 152.44 | No | ||||||||
| Intervals | |||||||||||
| 45.73 | 48.78 | 3.05 | 0.378 | ||||||||
| 51.83 | 54.88 | 3.05 | 0.611 | ||||||||
| 12EV225 | RC | 121.95 | 59.45 | 62.50 | 3.05 | 0.416 | |||||
| 74.70 | 79.27 | 4.57 | 1.261 | ||||||||
| 99.09 | 102.13 | 3.04 | 0.577 | ||||||||
| 12EV226 | RC | 152.44 | No | ||||||||
| Intervals | |||||||||||
| 54.88 | 62.50 | 7.62 | 0.424 | ||||||||
| 73.17 | 152.44 | 79.27 | 1.538 | ||||||||
| 12EV227 | RC | 227.13 | Inc. 129.57 | 131.10 | 1.53 | 14.90 | |||||
| Inc. 140.24 | 141.77 | 1.53 | 8.30 | ||||||||
| 155.49 | 207.32 | 51.83 | 1.200 | ||||||||
| 12EV228 | RC | 163.11 | 65.55 | 70.12 | 4.57 | 0.619 | |||||
| 73.17 | 82.32 | 9.15 | 0.697 | ||||||||
| 50.30 | 56.40 | 6.10 | 1.130 | ||||||||
| 82.32 | 91.46 | 9.14 | 3.060 | ||||||||
| 12EV229 | RC | 213.41 | Inc. 82.32 | 86.89 | 4.57 | 5.490 | |||||
| 120.43 | 126.52 | 6.09 | 1.880 | ||||||||
| 131.10 | 134.15 | 3.05 | 0.810 | ||||||||
| 176.83 | 181.40 | 4.57 | 0.808 | ||||||||
| (1) | Due to the exploratory nature of this program and the variable orientations of the mineralized zones, the intersections presented herein may not necessarily represent the true width of mineralization |
| (2) | RC = Reverse Circulation Hole |
| (3) | Number in bold represent intervals greater than 35 metres*grams/tonne (35gmt) |
| Table 5: East Estrella - Select Composite Intervals - Reverse Circulation Drilling1 | ||||||||||||
| Include intervals at >0.35 g/t Au over a 3 metres minimum width, no assay cut | ||||||||||||
DRILL HOLE |
DRILLING METHOD |
TOTAL DEPTH (m) |
FROM (m) |
TO (m) |
INT. (m) |
GOLD (g/t) |
||||||
| 12SX017 | RC | 106.71 | 50.30 | 53.35 | 3.05 | 2.425 | ||||||
| 70.12 | 73.17 | 3.05 | 0.575 | |||||||||
| 12SX018 | RC | 121.95 | 51.83 | 57.93 | 6.10 | 0.540 | ||||||
| 12SX019 | RC | 121.95 | 42.68 | 48.78 | 6.10 | 0.789 | ||||||
| 12SX020 | RC | 137.20 | 112.80 | 115.85 | 3.05 | 0.602 | ||||||
| 42.68 | 47.26 | 4.58 | 0.414 | |||||||||
| 83.84 | 89.94 | 6.10 | 0.996 | |||||||||
| 12SX021 | RC | 163.11 | 131.10 | 141.77 | 10.67 | 3.760 | ||||||
| Inc. 134.15 | 137.20 | 3.05 | 11.025 | |||||||||
| 147.87 | 160.06 | 12.19 | 2.316 | |||||||||
| (1) | Due to the exploratory nature of this program and the variable orientations of the mineralized zones, the intersections presented herein may not necessarily represent the true width of mineralization |
| (2) | RC = Reverse Circulation Hole |
| (3) | Number in bold represent intervals greater than 35 metres*grams/tonne (35gmt) |
To view "Figure 1: East Estrella - Located southeast of the Mulatos pit wall", please visit the following link: http://media3.marketwire.com/docs/alamos_map_501.jpg
The TSX has not reviewed and does not accept responsibility for the adequacy or accuracy of this release. No stock exchange, securities commission or other regulatory authority has approved or disapproved the information contained herein.
Contact Information:
John A. McCluskey
President and Chief Executive Officer
(416) 368-9932
Alamos Gold Inc.
Allan Candelario
Investor Relations
(416) 368-9932 x 406
www.alamosgold.com