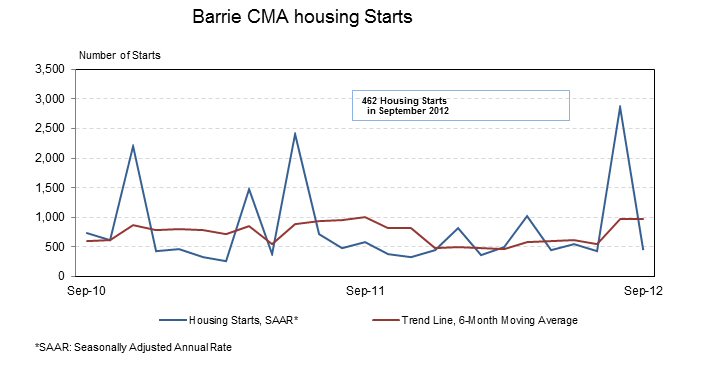
TORONTO, ONTARIO--(Marketwire - Oct. 9, 2012) - Housing starts in Barrie, Census Metropolitan Area (CMA) were trending at 965 units in September, according to Canada Mortgage and Housing Corporation (CMHC). The trend is a six month moving average of the monthly seasonally adjusted annual rates (SAAR)1 of housing starts. The standalone monthly SAAR was 462 units in September, down from 727 in August.
"Even though monthly starts are volatile over the course of the year, due to the introduction occasionally of multi-unit projects for apartments and rows, the trend measure shows that overall demand has been relatively steady in 2012," said Abdellah Massaoudi, CMHC's Market Analyst for Barrie.
CMHC uses the trend measure as a complement to the monthly SAAR of housing starts to account for considerable swings in monthly estimates and obtain a more complete picture of the state of the housing market. In some situations, analysing only SAAR data can be misleading in some markets, as they are largely driven by the multiples segment of the markets which can be quite variable from one month to the next. The multiples segment includes apartments, rows and semi-detached homes.
Single-detached starts added 54 actual units in September 2012. Other housing starts totalled six actual units in September down from nine units reported in September of last year. Year-to-date, housing starts reached 621 actual units with nearly 60 per cent of the total single-detached homes. Across the zones in the CMA, Innisfil Township is gaining momentum in the construction of single-detached homes in the last two years.
Preliminary Housing Starts data is also available in English and French at the following link: http://www.cmhc.gc.ca/en/hoficlincl/homain/stda/index.cfm
As Canada's national housing agency, CMHC draws on more than 65 years of experience to help Canadians access a variety of quality, environmentally sustainable and affordable housing solutions. CMHC also provides reliable, impartial and up-to-date housing market reports, analysis and knowledge to support and assist consumers and the housing industry in making informed decisions.
1 All starts figures in this release, other than actual starts and the trend estimate, are seasonally adjusted annual rates (SAAR) - that is, monthly figures adjusted to remove normal seasonal variation and multiplied by 12 to reflect annual levels. By removing seasonal ups and downs, seasonal adjustment allows for a comparison from one season to the next and from one month to the next. Reporting monthly figures at annual rates indicates the annual level of starts that would be obtained if the monthly pace was maintained for 12 months. This facilitates comparison of the current pace of activity to annual forecasts as well as to historical annual levels.
Additional data is available upon request.
(Ce document existe également en français)
To view the accompanying graph, visit the following link: http://media3.marketwire.com/docs/Barrie_CMA_Sept.jpg
| Preliminary Housing Start Data | |||
| September / 2011-2012 | |||
| Barrie, CMA1 | September 2011 | September 2012 | |
| Actual | |||
| September - Single-Detached | 66 | 54 | |
| September - Multiples | 9 | 6 | |
| September - Total | 75 | 60 | |
| January to Sept - Single-Detached | 279 | 363 | |
| January to September - Multiples | 330 | 258 | |
| January to September - Total | 609 | 621 | |
| August 2012 | September 2012 | ||
| SAAR2 | |||
| Total | 2862 | 462 | |
| Source: CMHC | |||
| 1 Census Metropolitan Area | |||
| 2 Seasonally Adjusted at Annual Rates | |||
| Detailed data available upon request. | |||
| Barrie Preliminary Actual Housing Start Data by Type | |||||||||||
| September / 2011-2012 | |||||||||||
| Barrie, CMA1 | Single | Semi | Row | Apt | Total |
||||||
| 2011 | 2012 | 2011 | 2012 | 2011 | 2012 | 2011 | 2012 | 2011 | 2012 | ||
| List of Zones | |||||||||||
| Barrie C | 39 | 21 | 0 | 0 | 8 | 0 | 0 | 0 | 39 | 21 | |
| Innisfil TP | 18 | 33 | 0 | 0 | 0 | 6 | 0 | 0 | 18 | 39 | |
| Springwater TP | 9 | 0 | 1 | 0 | 0 | 0 | 0 | 0 | 10 | 0 | |
| Total Barrie Starts | 66 | 54 | 1 | 0 | 8 | 6 | 0 | 0 | 67 | 60 | |
| Barrie Preliminary Actual Housing Start Data by Type | |||||||||||
| Year to Date / 2011-2012 | |||||||||||
| Barrie, CMA1 | Single | Semi | Row | Apt | Total |
||||||
| 2011 | 2012 | 2011 | 2012 | 2011 | 2012 | 2011 | 2012 | 2011 | 2012 | ||
| List of Zones | |||||||||||
| Barrie C | 145 | 150 | 0 | 4 | 40 | 122 | 267 | 90 | 452 | 366 | |
| Innisfil TP | 84 | 173 | 0 | 0 | 22 | 18 | 0 | 0 | 106 | 191 | |
| Springwater TP | 50 | 40 | 1 | 0 | 0 | 0 | 0 | 24 | 51 | 64 | |
| Total Barrie Starts | 279 | 363 | 1 | 4 | 62 | 140 | 267 | 114 | 609 | 621 | |
| 1 Census Metropolitan Area |
Contact Information:
Abdellah Massaoudi
416-218-3461
amassaou@cmhc.ca
Media Contact:
Beth Bailey
416-218-3355
Cell: 416-988-4615
Bbailey@cmhc.ca