NORFOLK, NE--(Marketwired - May 10, 2013) - Supertel Hospitality, Inc. (
2013 First Quarter Key Events
- Reduced our overall cost of capital with the completion of four debt-related transactions.
- Sold 2 non-core hotels with an average age of approximately 28 years.
- Following the close of the quarter, executing on its business strategy, the company signed purchase agreements to acquire four upper midscale hotels with its targeted brands, subject to obtaining financing and completing due diligence.
- Recorded essentially flat continuing operations revenues but had a (4.0) percent decline in same store revenue per available room (RevPAR) due primarily to disruption caused by brand changes at four core hotels.
- Reported a $1.1 million decline in Adjusted EBITDA to $1.3 million and a $1.7 million decline in Adjusted FFO.
First Quarter Operating and Financial Results
First quarter 2013 revenues from continuing operations rose 0.3 percent, to $14.6 million, compared to the same year-ago period. The improvement was due to the acquisition of the Hilton Garden Inn in Solomons Island, Maryland during the second quarter of 2012, partially offset by a decrease in occupancy on the same store hotels.
Supertel had a 2013 first quarter net loss attributable to common shareholders of $(4.9) million, or $(0.21) per diluted share, compared to $(4.6) million or $(0.20) per diluted share, for the same 2012 period.
Funds from operations (FFO) was $(2.4) million for the 2013 first quarter, compared to $(1.5) million in the same 2012 period. Adjusted funds from operations (AFFO), which is FFO adjusted to exclude gains and losses on derivative liabilities and acquisition expense, in the 2013 first quarter was $(2.0) million, compared to $(0.3) million in the same 2012 period.
Earnings before interest, taxes, depreciation and amortization (EBITDA) were essentially flat at $(0.4) million for the 2013 first quarter. Adjusted EBITDA, which is EBITDA before non controlling interest, net gain/loss on disposition of assets, impairment, preferred stock dividends, unrealized gain/loss on derivatives and acquisition expense, declined to $1.3 million, compared to $2.4 million for the 2012 first quarter.
In the 2013 first quarter, the 63-hotel, same store portfolio RevPAR declined (4.0) percent to $27.27, with a 2.2 percent improvement in ADR to $49.05, offset by a 6.1 percent decline in occupancy to 55.6 percent, compared to the 2012 first quarter.
"The majority of our RevPAR decline was due to the displacement caused by the changing of brands at four hotels impacting our Tennessee, Kentucky, and North Carolina results, combined with the drop in occupancy in Louisiana as a result of decreased business from the natural gas production industry, coupled with an increase in market supply," said Kelly Walters, Supertel's president and chief executive officer. "Excluding the four reflagged hotels from our results, first quarter RevPAR from the other 59 continuing operations hotels was $26.70, a decrease of 1.6 percent over prior year.
"These difficult results further reinforce our decision to reconfigure our portfolio to premium-branded, select service hotels," he noted. "All four hotels were reflagged due to the franchise agreement expiration and they no longer fit their prior brand's standards. We invested a total of $1.9 million to renovate the hotels to conform to their new flags. Successfully changing brands is a lengthy process, and will require time to ramp-up as we introduce the new brands to their market. We expect to continue to experience displacement at these properties. The hotels are in good physical condition, but we anticipate that the properties will have difficulty achieving the same rate as their previous flag. We are working closely with the operators to position these hotels properly to recapture occupancy and room rate as effectively as possible."
| Property | Date of Rebranding | Flag | ||
| Harlan, KY | Estimated June 2013 | Holiday Inn Express to Comfort Inn | ||
| Fayetteville, NC | March, 2013 | Comfort Inn to Rodeway Inn | ||
| Shelby, NC | April, 2013 | Hampton Inn to Comfort Inn | ||
| Cleveland, TN | February, 2013 | Hampton Inn to Clarion |
The impact of the rebranding on 2013 first quarter results is as follows:
| Three months ended March 31, 2013 | Three months ended March 31, 2012 | Percent of Change | ||||||||||||
| RevPar | Occ | ADR | RevPar | Occ | ADR | RevPAR | Occ | ADR | ||||||
| Harlan, KY | $25.95 | 34.1% | $76.02 | $38.78 | 51.2% | $75.75 | -33.1% | -33.4% | 0.4% | |||||
| Fayetteville, NC | 37.46 | 60.5% | 61.89 | 44.93 | 69.8% | 64.33 | -16.6% | -13.3% | -3.8% | |||||
| Shelby, NC | 45.01 | 66.5% | 72.37 | 48.39 | 67.0% | 72.23 | -7.0% | -0.7% | 0.2% | |||||
| Cleveland, TN | 34.49 | 47.8% | 72.19 | 68.48 | 83.2% | 82.28 | -49.6% | -42.5% | -12.3% | |||||
| $36.47 | 53.4% | $68.30 | $48.94 | 68.0% | $71.97 | -25.5% | -21.5% | -5.1% | ||||||
Including all 63 continuing operations hotels, Supertel's first quarter results were:
| First Quarter 2013 vs First Quarter 2012 | ||||||||||||||||||
| Occ % | ADR ($) | RevPAR ($) | ||||||||||||||||
| 2013 | 2012 | Variance | 2013 | 2012 | Variance | 2013 | 2012 | Variance | ||||||||||
| Industry - Total US Market | 57.7% | 56.7% | 1.8% | 108.31 | 103.63 | 4.5% | 62.47 | 58.71 | 6.4% | |||||||||
| Supertel - Same Store 63 hotels (1) | 55.6% | 59.2% | -6.1% | 49.05 | 48.01 | 2.2% | 27.27 | 28.40 | -4.0% | |||||||||
| Chain Scale (2) | ||||||||||||||||||
| Industry - Upper Midscale | 58.0% | 57.5% | 0.9% | 96.41 | 93.1 | 3.6% | 55.94 | 53.53 | 4.5% | |||||||||
| Supertel - Upper Midscale 19 hotels (3) | 54.9% | 61.4% | -10.6% | 67.32 | 66.31 | 1.5% | 36.99 | 40.70 | -9.1% | |||||||||
| Industry - Midscale | 50.3% | 49.3% | 2.0% | 73.2 | 70.92 | 3.2% | 36.83 | 34.97 | 5.3% | |||||||||
| Supertel - Midscale 3 hotels | 35.1% | 36.2% | -3.0% | 58.81 | 57.79 | 1.8% | 20.62 | 20.90 | -1.3% | |||||||||
| Industry - Economy | 50.1% | 49.3% | 1.6% | 50.95 | 49.07 | 3.8% | 25.55 | 24.20 | 5.6% | |||||||||
| Supertel - Economy 34 hotels (3) | 52.0% | 54.7% | -4.9% | 51.49 | 49.77 | 3.5% | 26.79 | 27.2 | -1.5% | |||||||||
| Industry - Extended Stay | n/a | n/a | n/a | n/a | n/a | n/a | n/a | n/a | n/a | |||||||||
| Supertel - Extended Stay 7 hotels | 69.0% | 71.9% | -4.0% | 25.52 | 24.4 | 4.6% | 17.61 | 17.54 | 0.4% | |||||||||
| Industry Source: STR Monthly Review | ||||||||||||||||||
| (1) | The comparisons for same store operations are for 63 hotels in continuing operations as of March 31, 2013. Comparative operating results for the Hilton Garden Inn, which was acquired in the 2012 second quarter, are not reflected in the 63 same-store hotel operating results shown above. |
| (2) | Supertel's chain scale classifications are as follows: Upper midscale hotel brands currently in the company's portfolio include Comfort Inns, Comfort Suites, and Hampton Inn; Midscale brands include Quality Inn, Sleep Inn and Baymont Inn; Economy brands include Days Inn, Super 8, Key West Inns and Guesthouse Inn; Extended stay brands include the Savannah Suites. |
| (3) | The Fayetteville, North Carolina hotel has been moved from the Upper Midscale category to the Economy category during the reporting period because of its rebranding. |
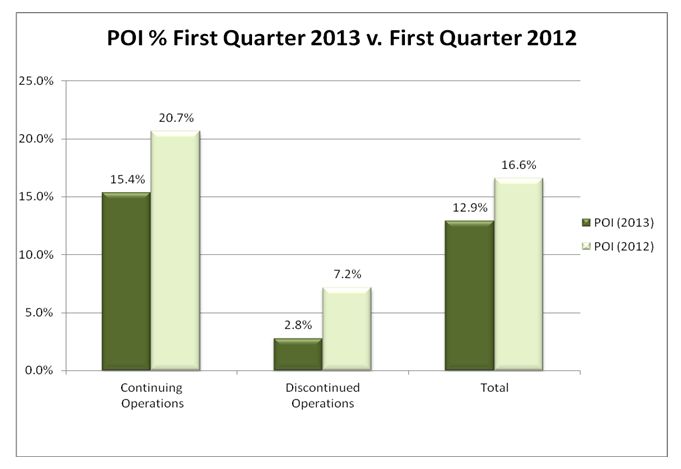
Property operating income (POI), an important operating measurement, is the revenue from room rentals and other hotel services less hotel and property operating expenses. For the 2013 first quarter, POI from continuing operations declined 25.5 percent to $2.2 million, compared to $3.0 million for the same period a year earlier, led by the displacement caused by the reflagging in Tennessee, North Carolina and Kentucky, and RevPAR decreases in the West South Central region.
See attached chart Property Operating Income (POI) First Quarter 2013 versus First Quarter 2012.
Subsequent Events
On May 9, the company entered into agreements to acquire four hotels for an aggregate purchase price of $42.25 million. The agreements contain the standard terms associated with due diligence and are also subject to Supertel securing financing satisfactory to Supertel by August 15, 2013 to purchase the hotels.
The hotels include the 89-room Home2 Suites by Hilton in Charlotte, North Carolina; the 100- room Hampton Inn and Suites in Columbia, South Carolina; the 109-room Hampton Inn and Suites in Pine Knoll Shores, North Carolina; and the 80-room Fairfield Inn and Suites in Wytheville, Virginia. The closing of the transactions is subject to customary closing conditions in addition to the due diligence and financing conditions.
"This is another step in reconfiguring Supertel into a stronger company that we believe will be capable of producing sustainable, competitive returns for our shareholders," Walters said.
Disposition Program
In the 2013 first quarter the company sold the 63-room GuestHouse Inn in Ellenton, Florida for $1.26 million, and the 120-room Days Inn (North) in Fredericksburg, Virginia, for $2.05 million. Proceeds were used primarily to improve the balance sheet by reducing debt and lowering debt service.
Following the close of the 2013 first quarter, the company sold two hotels, the 40-room Super 8 in Fort Madison, Iowa on April 18, 2013 for $1.1 million and the 151-room Masters Inn in Tuscaloosa, Alabama on May 1, 2013 for $1.59 million. Proceeds were used to retire the associated debt.
Capital Reinvestment
The company invested $1.5 million in property improvements in the 2013 first quarter, primarily for the rebranding of the four previously mentioned hotels. "Our plan calls for investing approximately $8 million for renovations in 2013, up 40.4 percent from 2012. We are investing to maintain brand standards and a competitive physical condition in order to achieve stronger returns.
"We are seeing the benefit of the $3.5 million invested in upgrades at four of the five hotels in Northern Indiana. The remaining hotel benefited from onetime business and events in the first quarter last year making comparisons difficult. The renovations have been well received by guests and our operator(s) have moved quickly to build RevPAR. RevPAR at the four hotels for the 2013 first quarter is up 3.6 percent over the same period last year," he said.
Balance Sheet
The company completed four debt-related transactions in the 2013 first quarter to further strengthen its balance sheet by paying down debt, reducing interest rates on existing loans and extending the length of loans. The transactions included:
- On March 26, the company amended its $12.5 million Great Western Bank revolving credit facility to extend the maturity date from June 30, 2013 to June 30, 2014 and reduced the interest rate from 5.95 percent to 4.95 percent. In addition the company amended its Great Western Bank $14 million in term loans, extending the maturity date from June 30, 2013 to June 30, 2015 and reduced the interest rate from 6.0 percent to 5.0 percent.
- On March 28, the company paid down $5.3 million on its loan with GE Franchise Finance Commercial LLC in exchange for the release of three Masters Inn properties, one of which was subsequently sold on May 1, 2013. Supertel currently is marketing the remaining two Masters Inn hotels for sale.
- On February 21, the company's interest rate on its $2.9 million loan with Elkhorn Valley Bank was lowered from 6.25 percent to 5.5 percent.
- On January 10, the company obtained a $2.4 million loan from First State Bank, Fremont Nebraska. The mortgage loan is secured by four hotels, one of which was subsequently sold. The loan carries a 5.5 percent interest rate and matures September 1, 2016.
"These financings with better terms reflect the continued strengthening of our balance sheet, which have made Supertel a more creditworthy borrower," said Walters. "The lower rates are projected to reduce our borrowing costs for the remainder of the year."
As of March 31, 2013, Supertel had $115.6 million in outstanding debt on its continuing operations hotels with an average term of 3.6 years and weighted average annual interest rate of 5.8 percent.
Dividends
The company did not declare a dividend on common stock in the 2013 first quarter. Preferred dividends continued uninterrupted. The board of directors will continue to monitor the dividend policy on a quarterly basis.
Outlook 2013
"It was a frustrating quarter from an operating viewpoint due primarily to the reflagging of our hotels," Walters said. "For several years Supertel has outperformed the market occupancy statistics, but lagged in room rate. During the first quarter of 2013, we pushed rate to determine the elasticity of our demand, and our results were unfavorably impacted. As a result, we have instructed our operators to price as competitively as necessary to regain market share going forward," Walters added. "Longer-term, the period was one of our most important. We made a number of solid steps to further enhance our balance sheet and continue our planned pace of our disposition program."
"We are in the midst of taking a major step forward in our portfolio re-configuration program with the signing of the agreements to purchase four hotels," he noted. "We still have a great deal of work to do if these transactions are to be completed, but the foundation work we did in 2012 should serve us well in 2013."
About Supertel Hospitality, Inc.
Supertel Hospitality, Inc. (
Forward Looking Statement
Certain matters within this press release are discussed using forward-looking language as specified in the Private Securities Litigation Reform Act of 1995, and, as such, may involve known and unknown risks, uncertainties and other factors that may cause the actual results or performance to differ from those projected in the forward-looking statement. These risks are discussed in the Company's filings with the Securities and Exchange Commission.
| SELECTED FINANCIAL DATA: |
| Supertel Hospitality, Inc. |
| Balance Sheet |
| As of March 31, 2013 and December 31, 2012 |
| (Dollars in thousands, except share and per share data) |
The company owned 84 hotels (including 20 hotels in discontinued operations) at March 31, 2013, and 86 hotels as of December 31, 2012, respectively.
| As of | ||||||||||
| March 31, | December 31, | |||||||||
| 2013 | 2012 | |||||||||
| (unaudited) | ||||||||||
| ASSETS | ||||||||||
| Investments in hotel properties | $ | 238,120 | $ | 236,992 | ||||||
| Less accumulated depreciation | 75,437 | 73,665 | ||||||||
| 162,683 | 163,327 | |||||||||
| Cash and cash equivalents | 337 | 891 | ||||||||
| Accounts receivable, net of allowance for doubtful accounts of $161 and $201 | 2,170 | 2,070 | ||||||||
| Prepaid expenses and other assets | 5,347 | 5,151 | ||||||||
| Deferred financing costs, net | 2,552 | 2,644 | ||||||||
| Investment in hotel properties, held for sale, net | 24,299 | 27,764 | ||||||||
| $ | 197,388 | $ | 201,847 | |||||||
| LIABILITIES AND EQUITY | ||||||||||
| LIABILITIES | ||||||||||
| Accounts payable, accrued expenses and other liabilities | $ | 10,350 | $ | 8,778 | ||||||
| Derivative liabilities, at fair value | 16,252 | 15,935 | ||||||||
| Debt related to hotel properties held for sale | 15,754 | 20,416 | ||||||||
| Long-term debt | 115,609 | 112,405 | ||||||||
| 157,965 | 157,534 | |||||||||
| Redeemable preferred stock | ||||||||||
| 10% Series B, 800,000 shares authorized; $.01 par value, 332,500 shares outstanding, liquidation preference of $8,312 | 7,662 | 7,662 | ||||||||
| EQUITY | ||||||||||
| Shareholders' equity | ||||||||||
| Preferred stock, 40,000,000 shares authorized; | ||||||||||
| 8% Series A, 2,500,000 shares authorized, $.01 par value, 803,270 shares outstanding, liquidation preference of $8,033 | 8 | 8 | ||||||||
| 6.25% Series C, 3,000,000 shares authorized, $.01 par value, 3,000,000 shares outstanding, liquidation preference of $30,000 | 30 | 30 | ||||||||
| Common stock, $.01 par value, 200,000,000 shares authorized; | ||||||||||
| 23,145,927 and 23,145,927 shares outstanding | 231 | 231 | ||||||||
| Common stock warrants | 252 | 252 | ||||||||
| Additional paid-in capital | 134,804 | 134,792 | ||||||||
| Distributions in excess of retained earnings | (103,672 | ) | (98,777 | ) | ||||||
| Total shareholders' equity | 31,653 | 36,536 | ||||||||
| Noncontrolling interest | ||||||||||
| Noncontrolling interest in consolidated partnership, redemption value $113 and $99 | 108 | 115 | ||||||||
| Total equity | 31,761 | 36,651 | ||||||||
| COMMITMENTS AND CONTINGENCIES | ||||||||||
| $ | 197,388 | $ | 201,847 | |||||||
| Supertel Hospitality, Inc. |
| Results of Operations |
| For the three months ended March 31, 2013 and 2012, respectively |
(Dollars in thousands, except per share data)
| Three Months Ended | |||||||||
| March 31, | |||||||||
| 2013 | 2012 | ||||||||
| REVENUES | (unaudited) | ||||||||
| Room rentals and other hotel services | $ | 14,627 | $ | 14,583 | |||||
| EXPENSES | |||||||||
| Hotel and property operations | 12,381 | 11,569 | |||||||
| Depreciation and amortization | 1,961 | 1,840 | |||||||
| General and administrative | 1,059 | 1,092 | |||||||
| Acquisition, termination expense | 21 | 1 | |||||||
| 15,422 | 14,502 | ||||||||
| EARNINGS BEFORE NET LOSS ON DISPOSITIONS OF ASSETS, OTHER INCOME, INTEREST EXPENSEAND INCOME TAXES | (795 | ) | 81 | ||||||
| Net loss on dispositions of assets | (29 | ) | (4 | ) | |||||
| Other income (loss) | (297 | ) | (1,212 | ) | |||||
| Interest expense | (1,849 | ) | (1,868 | ) | |||||
| Loss on debt extinguishment | (91 | ) | (12 | ) | |||||
| Impairment | - | 266 | |||||||
| LOSS FROM CONTINUING OPERATIONS BEFORE INCOME TAXES | (3,061 | ) | (2,749 | ) | |||||
| Income tax expense (benefit) | 0 | (314 | ) | ||||||
| LOSS FROM CONTINUING OPERATIONS | (3,061 | ) | (2,435 | ) | |||||
| Loss from discontinued operations, net of tax | (1,004 | ) | (1,536 | ) | |||||
| NET LOSS | (4,065 | ) | (3,971 | ) | |||||
| Loss attributable to noncontrolling interest | 7 | 6 | |||||||
| NET LOSS ATTRIBUTABLE TO CONTROLLING INTERESTS | (4,058 | ) | (3,965 | ) | |||||
| Preferred stock dividends | (837 | ) | (657 | ) | |||||
| NET LOSS ATTRIBUTABLE TO COMMON SHAREHOLDERS | |||||||||
| $ | (4,895 | ) | $ | (4,622 | ) | ||||
| NET LOSS PER COMMON SHARE - BASIC AND DILUTED | |||||||||
| EPS Basic and Diluted | $ | (0.21 | ) | $ | (0.20 | ) | |||
| RECONCILIATION OF NON-GAAP FINANCIAL MEASURES |
(Unaudited - In thousands, except per share data)
| Three months ended March 31, | |||||||||
| 2013 | 2012 | ||||||||
| Weighted average number of shares outstanding for: | |||||||||
| calculation of FFO per share - basic | 23,101 | 23,070 | |||||||
| calculation of FFO per share - diluted | 23,101 | 23,070 | |||||||
| RECONCILIATION OF NET INCOME (LOSS) TO FFO | |||||||||
| Net loss attributable to common shareholders | $ | (4,895 | ) | $ | (4,622 | ) | |||
| Depreciation and amortization | 1,961 | 2,170 | |||||||
| Net gain loss on disposition of assets | 53 | (490 | ) | ||||||
| Impairment | 507 | 1,434 | |||||||
| FFO available to common shareholders | $ | (2,374 | ) | $ | (1,508 | ) | |||
| Unrealized (gain) loss on derivatives | 317 | 1,213 | |||||||
| Acquisition expense | 21 | 1 | |||||||
| Adjusted FFO | $ | (2,036 | ) | $ | (294 | ) | |||
| FFO per share - basic | (0.10 | ) | (0.07 | ) | |||||
| Adjusted FFO per share - basic | (0.09 | ) | (0.01 | ) | |||||
| FFO per share - diluted | (0.10 | ) | (0.07 | ) | |||||
| Adjusted FFO per share - diluted | (0.09 | ) | (0.01 | ) | |||||
FFO and Adjusted FFO ("AFFO") are non-GAAP financial measures. We consider FFO and AFFO to be market accepted measures of an equity REIT's operating performance, which are necessary, along with net earnings (loss), for an understanding of our operating results. FFO, as defined under the National Association of Real Estate Investment Trusts (NAREIT) standards, consists of net income computed in accordance with GAAP, excluding gains (or losses) from sales of real estate assets, plus depreciation, amortization and impairment of real estate assets. We believe our method of calculating FFO complies with the NAREIT definition. AFFO is FFO adjusted to exclude gains or losses on derivative liabilities, which are non-cash charges against income and which do not represent results from our core operations. AFFO also adds back acquisition costs. FFO and AFFO do not represent amounts available for management's discretionary use because of needed capital replacement or expansion, debt service obligations, or other commitments and uncertainties. FFO and AFFO should not be considered as alternatives to net income (loss) (computed in accordance with GAAP) as an indicator of our liquidity, nor are they indicative of funds available to fund our cash needs, including our ability to pay dividends or make distributions. All REITs do not calculate FFO and AFFO in the same manner; therefore, our calculation may not be the same as the calculation of FFO and AFFO for similar REITs.
Diluted FFO per share and diluted Adjusted FFO per share are computed after adjusting the numerator and denominator of the basic computation for the effects of any dilutive potential common shares outstanding during the period. The Company's outstanding warrants to purchase common stock Series C convertible preferred stock, preferred operating units, unvested stock awards and stock options would be antidilutive and are not included in the dilution computation.
We use FFO and AFFO as performance measures to facilitate a periodic evaluation of our operating results relative to those of our peers. We consider FFO and AFFO to be useful additional measures of performance for an equity REIT because it facilitates an understanding of the operating performance of our properties without giving effect to real estate depreciation and amortization, which assume that the value of real estate assets diminishes predictably over time. Since real estate values have historically risen or fallen with market conditions, we believe that FFO and AFFO provide a meaningful indication of our performance.
| EBITDA and Adjusted EBITDA |
(Unaudited - In thousands)
| Three months ended March 31, | |||||||||
| 2013 | 2012 | ||||||||
| RECONCILIATION OF NET LOSS TO ADJUSTED EBITDA | |||||||||
| Net loss attributable to common shareholders | $ | (4,895 | ) | $ | (4,622 | ) | |||
| Interest expense, including discontinued operations | 2,230 | 2,666 | |||||||
| Loss on debt extinguishment | 283 | 12 | |||||||
| Income tax benefit, including discontinued operations | - | (662 | ) | ||||||
| Depreciation and amortization, including discontinued operations | 1,961 | 2,170 | |||||||
| EBITDA | (421 | ) | (436 | ) | |||||
| Noncontrolling interest | (7 | ) | (6 | ) | |||||
| Net (gain) loss on disposition of assets | 53 | (490 | ) | ||||||
| Impairment | 507 | 1,434 | |||||||
| Preferred stock dividends | 837 | 657 | |||||||
| Unrealized loss on derivatives | 317 | 1,213 | |||||||
| Acquisition expense | 21 | 1 | |||||||
| Adjusted EBITDA | $ | 1,307 | $ | 2,373 | |||||
EBITDA and Adjusted EBITDA are financial measures that are not calculated in accordance with accounting principles generally accepted in the United States of America ("GAAP"). We calculate EBITDA and Adjusted EBITDA by adding back to net earnings (loss) available to common shareholders certain non-operating expenses and non-cash charges which are based on historical cost accounting and we believe may be of limited significance in evaluating current performance. We believe these adjustments can help eliminate the accounting effects of depreciation and amortization and financing decisions and facilitate comparisons of core operating profitability between periods, even though EBITDA and Adjusted EBITDA also do not represent an amount that accrues directly to common shareholders. In calculating Adjusted EBITDA, we add back noncontrolling interest, net (gain) loss on disposition of assets, preferred stock dividends and acquisition expenses which are cash charges. We also add back impairment and unrealized gain or loss on derivatives, which are non-cash charges.
EBITDA and Adjusted EBITDA do not represent cash generated from operating activities determined by GAAP and should not be considered as alternatives to net income, cash flow from operations or any other operating performance measure prescribed by GAAP. EBITDA and Adjusted EBITDA are not measures of our liquidity, nor are they indicative of funds available to fund our cash needs, including our ability to make cash distributions. Neither do the measurements reflect cash expenditures for long-term assets and other items that have been and will be incurred. EBITDA and Adjusted EBITDA may include funds that may not be available for management's discretionary use due to functional requirements to conserve funds for capital expenditures, property acquisitions, and other commitments and uncertainties. To compensate for this, management considers the impact of these excluded items to the extent they are material to operating decisions or the evaluation of our operating performance. EBITDA and Adjusted EBITDA, as presented, may not be comparable to similarly titled measures of other companies.
| Property Operating Income (POI) - Continuing and Discontinued Operations |
This presentation includes non-GAAP financial measures. The company believes that the presentation of hotel property operating income (POI) is helpful to investors, and represents a more useful description of its core operations, as it better communicates the comparability of its hotels' operating results.
(Unaudited - In thousands, except statistical data)
| Three months ended | ||||||||
| March 31, | ||||||||
| 2013 | 2012 | |||||||
| Total Hotels in Continuing Operations: | ||||||||
| Revenue per available room (RevPAR): | $ | 28.14 | $ | 28.40 | ||||
| Average daily room rate (ADR): | $ | 50.55 | $ | 48.01 | ||||
| Occupancy percentage: | 55.7 | % | 59.2 | % | ||||
| Revenue from room rentals and other hotel services consists of: | ||||||||
| Room rental revenue | $ | 14,066 | $ | 14,106 | ||||
| Telephone revenue | 74 | 77 | ||||||
| Other hotel service revenues | 487 | 400 | ||||||
| Total revenue from room rentals and other hotel services | $ | 14,627 | $ | 14,583 | ||||
| Room rentals and other hotel services | ||||||||
| Total room rental and other hotel services | $ | 14,627 | $ | 14,583 | ||||
| Hotel and property operations expense | ||||||||
| Total hotel and property operations expense | $ | 12,381 | $ | 11,569 | ||||
| Property Operating Income ("POI") | ||||||||
| Total property operating income | $ | 2,246 | $ | 3,014 | ||||
| POI as a percentage of revenue from room rentals and other hotel services | ||||||||
| Total POI as a percentage of revenue | 15.4 | % | 20.7 | % | ||||
| Discontinued Operations | ||||||||
| Room rentals and other hotel services | ||||||||
| Total room rental and other hotel services | $ | 3,551 | $ | 6,287 | ||||
| Hotel and property operations expense | ||||||||
| Total hotel and property operations expense | $ | 3,451 | $ | 5,837 | ||||
| Property Operating Income ("POI") | ||||||||
| Total property operating income | $ | 100 | $ | 450 | ||||
| POI as a percentage of revenue from room rentals and other hotel services | ||||||||
| Total POI as a percentage of revenue | 2.8 | % | 7.2 | % | ||||
(Unaudited - In thousands, except statistical data)
| Three months ended | |||||||
| March 31, | |||||||
| RECONCILIATION OF NET LOSS TO POI | 2013 | 2012 | |||||
| Net loss from continuing operations | $ | (3,061 | ) | $ | (2,435 | ) | |
| Depreciation and amortization | 1,961 | 1,840 | |||||
| Net loss on disposition of assets. | 29 | 4 | |||||
| Other (income) expense | 297 | 1,212 | |||||
| Interest expense | 1,849 | 1,868 | |||||
| Loss on debt extinguishment | 91 | 12 | |||||
| General and administrative expense | 1,059 | 1,092 | |||||
| Acquisition, termination expense | 21 | 1 | |||||
| Income tax (benefit) expense | 0 | (314 | ) | ||||
| Impairment expense | - | (266 | ) | ||||
| POI--continuing operations | 2,246 | 3,014 | |||||
| Three months ended | |||||||
| March 31, | |||||||
| Reconciliation of gain (loss) from discontinued operations to POI - discontinued operations: | 2013 | 2012 | |||||
| Loss from discontinued operations | $ | (1,004 | ) | $ | (1,536 | ) | |
| Depreciation and amortization from discontinued operations | - | 330 | |||||
| Net gain on disposition of assets from discontinued operations | 24 | (494 | ) | ||||
| Interest expense from discontinued operations | 381 | 798 | |||||
| Loss on debt extinguishment | 192 | - | |||||
| Impairment (gain) losses from discontinued operations | 507 | 1,700 | |||||
| Income tax expense (benefit) from discontinued operations | 0 | (348 | ) | ||||
| POI--discontinued operations | $ | 100 | $ | 450 | |||
| Three months | ||||||||
| ended March 31, | ||||||||
| 2013 | 2012 | |||||||
| POI--continuing operations | 2,246 | 3,014 | ||||||
| POI--discontinued operations | 100 | 450 | ||||||
| Total - POI | $ | 2,346 | $ | 3,464 | ||||
| Total POI as a percentage of revenues | 12.9 | % | 16.6 | % | ||||
Same Store reflects 63 hotels in continuing operations owned as of January 1, 2012 and excludes one property acquired during the second quarter of 2012.
| Supertel Hospitality, Inc. |
| Operating Statistics by Region |
| For three months ended March 31, 2013 and 2012, respectively |
(Unaudited - except per share data)
| Three months ended March 31, 2013 | Three months ended March 31, 2012 | ||||||||||||||
Region |
Room Count |
RevPAR |
Occ |
ADR |
Room Count |
RevPAR |
Occ |
ADR |
|||||||
| Mountain | 214 | $25.05 | 51.8% | $48.37 | 214 | $25.49 | 53.8% | $47.35 | |||||||
| West North Central | 1,352 | 25.57 | 51.6% | 49.57 | 1,352 | 24.94 | 51.9% | 48.10 | |||||||
| East North Central | 923 | 29.76 | 50.3% | 59.11 | 923 | 29.81 | 51.4% | 58.03 | |||||||
| Middle Atlantic | 142 | 34.84 | 60.7% | 57.40 | 142 | 34.61 | 61.8% | 56.01 | |||||||
| South Atlantic | 2,169 | 27.35 | 63.0% | 43.40 | 2,169 | 28.95 | 69.1% | 41.91 | |||||||
| East South Central | 430 | 29.02 | 46.9% | 61.85 | 430 | 34.63 | 53.2% | 65.07 | |||||||
| West South Central | 225 | 20.36 | 46.4% | 43.89 | 225 | 25.00 | 54.1% | 46.24 | |||||||
| Total Same Store | 5,455 | $27.27 | 55.6% | $49.05 | 5,455 | $28.40 | 59.2% | $48.01 | |||||||
| South Atlantic Acquisitions | 100 | $75.75 | 59.9% | $126.48 | - | $ - | 0.0% | $ - | |||||||
| Total Acquisitions | 100 | $75.75 | 59.9% | $126.48 | - | $ - | 0.0% | $ - | |||||||
| Total | 5,555 | $28.14 | 55.7% | $50.55 | 5,455 | $28.40 | 59.2% | $48.01 | |||||||
| Percent of Change | |||||
| Region | RevPAR | Occ | ADR | ||
| Mountain | -1.7% | -3.7% | 2.2% | ||
| West North Central | 2.5% | -0.6% | 3.1% | ||
| East North Central | -0.2% | -2.1% | 1.9% | ||
| Middle Atlantic | 0.7% | -1.8% | 2.5% | ||
| South Atlantic | -5.5% | -8.8% | 3.6% | ||
| East South Central | -16.2% | -11.8% | -4.9% | ||
| West South Central | -18.6% | -14.2% | -5.1% | ||
| Total Same Store | -4.0% | -6.1% | 2.2% | ||
| South Atlantic Acquisitions | - | - | - | ||
| Total Acquisitions | - | - | - | ||
| Total | -0.9% | -5.9% | 5.3% | ||
| States included in the Regions | |
| Mountain | Idaho and Montana |
| West North Central | Iowa, Kansas, Missouri, Nebraska and South Dakota |
| East North Central | Indiana and Wisconsin |
| Middle Atlantic | Pennsylvania |
| South Atlantic | Florida, Georgia, Maryland, North Carolina, South Carolina, Virginia and West Virginia |
| East South Central | Kentucky and Tennessee |
| West South Central | Arkansas and Louisiana |
| Operating Statistics by Chain Scale Classification |
| For three months ended March 31, 2013 and 2012, respectively |
The comparisons of same store operations are for 63 hotels in continuing operations as of January 1, 2012.
(Unaudited - except per share data)
| Three months ended March 31, 2013 |
Three months ended March 31, 2012 |
Percent of Change | ||||||||||||
| Same Store: | RevPar | Occ | ADR | RevPar | Occ | ADR | RevPAR | Occ | ADR | |||||
| Upper Midscale | $36.99 | 54.9% | $67.32 | $40.70 | 61.4% | $66.31 | -9.1% | -10.6% | 1.5% | |||||
| Midscale | 20.62 | 35.1% | 58.81 | 20.90 | 36.2% | 57.79 | -1.3% | -3.0% | 1.8% | |||||
| Economy | 26.79 | 52.0% | 51.49 | 27.20 | 54.7% | 49.77 | -1.5% | -4.9% | 3.5% | |||||
| Extended Stay | 17.61 | 69.0% | 25.52 | 17.54 | 71.9% | 24.40 | 0.4% | -4.0% | 4.6% | |||||
| Total | $27.27 | 55.6% | $49.05 | $28.40 | 59.2% | $48.01 | -4.0% | -6.1% | 2.2% | |||||
Same store reflects 63 hotels.
Contact Information:
Contact:
Ms. Krista Arkfeld
Director of Corporate Communications
karkfeld@supertelinc.com