VANCOUVER, BRITISH COLUMBIA--(Marketwired - May 14, 2013) - Deans Knight Income Corporation (the "Company") (TSX:DNC) is pleased to provide an operational update of the Company and the Company's quarterly portfolio disclosure for the three months ended March 31, 2013.
Highlights during the Quarter:
- At March 31, 2013, the net asset value ("NAV") of the Company was $13.43 per Share.
- Net investment income1 for the three months ended March 31, 2013 was $1.88 million, or $0.1782 per Share.
- The Company paid dividends of $0.1749 per share on all of its outstanding voting and non-voting common shares (collectively, the "Shares") for the three months ended March 31, 2013, which equated to 98% of net investment income.
- Cash and cash equivalents in the Company at March 31, 2013 were at a similar level to the balance at December 31, 2012. They totaled $21.35 million, or 15.1% of the NAV.
- Subsequent to quarter end, the TSX accepted the Company's notice of intention to make a Normal Course Issuer's Bid. The NCIB provides that the Company may purchase for cancellation up to 10% of the public float, or approximately 956,000 Shares.
Corporate:
During the three months ended March 31, 2013, the Company generated net investment income of $1.88 million. In addition to net investment income, the Company also incurred $0.23 million of realized capital losses to March 31, 2013 from the sale of certain holdings and the settlement of foreign currency contracts. The Company paid out $1.84 million in dividends, equalling $0.0583 per Share each month or $0.1749 per Share for the quarter. This represented approximately 98% of net investment income.
On April 4, 2013 the Company announced it will continue to pay the monthly dividends of $0.0583 per Share throughout the second quarter of 2013.
In early May 2013, the Company responded to a letter from Canada Revenue Agency ("CRA") advising the Company that it is under audit for the taxation years 2008 to 2012, being those that end after the recapitalization and reorganization of the Company. The Company believes the audit is a normal course audit and has provided the CRA with the information requested. The CRA has asserted no opinion on the Company's use of its tax attributes in the years under audit and, after consultation with its legal counsel, the Company remains of the view that such tax attributes were eligible for use by the Company.
| 1 | The Company calculates net investment income as interest income less the on-going operating costs of the Company, and excluding any realized capital gains and losses and any income or loss not derived from debt securities. |
Investments:
At March 31, 2013, as a percentage of Net Asset Value, the portfolio has 68.2% in high yield and convertible bonds, 8.4% in private debt financings, 5.8% in equity, and 15.1% in cash; the remaining 2.5% of NAV consists primarily of accrued income and future tax assets net of liabilities. The equity consisted predominantly of shares in Whitecap Resources Inc., which arose from the conversion of private debt that the Company provided to Whitecap in September 2009. The investment has done very well. As of March 31, 2013, the shares were trading at 3 times the conversion price and Whitecap started paying a monthly dividend of $0.05 per share in February 2013.
The Company's portfolio provided a return on Net Asset Value of 0.1% during the 1st quarter, 1.3% for the last 12 months, and an annualized return of 13.2% since going public on March 17, 2009. Currently, the Company's portfolio has a short duration (3 years) and provides a coupon yield of 7%.
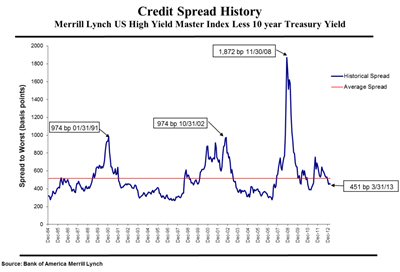
Interest rates in North America are at 50-year lows. However, the spread between High Yield and Government bonds is still near the long term average. Please refer to graph below. The Company does not view a 1.8% 10-year U.S. treasury bond as an attractive investment. As famed investor James Grant would say, the U.S. government is offering investors "return-free risk".
To view the graph associated to this release, please visit the following link: http://media3.marketwire.com/docs/514dnc_graph.jpg.
The Company is very selective when it comes to investing in high yield bonds. At March 31, 2013, the portfolio held 26 issues, by contrast, the high yield universe has over 2,000 issues. Investing in a concentrated portfolio of the best opportunities allows the Company to provide a higher level of income than the index while preserving capital over the long term. To give you an idea of the types of companies in the portfolio, we include some brief comments on a few of the bond holdings.
Paramount Resources 8.25% due December 13, 2017. Paramount is an Alberta based intermediate natural gas exploration and production Company with assets in Alberta, Northwest Territories, and North Dakota. Paramount expects to more than double its production from 22,000 boepd to a run rate of 50,000 boepd in 2014, as their gas plant in Musreau is commissioned and their Montney wells are brought on stream. Paramount estimates the free cash flow, after CAPEX, from their Montney play alone will be $340 - $520 million. In addition to its producing assets, Paramount has an extensive land position and a number of investments in other, predominantly public, oil and gas companies. It has a current market cap of $3.3 billion, of which management owns 50%, and the value of their holdings in public companies alone, being $800 million, is worth more than their debt outstanding of $700 million. The bonds owned by the Company are currently yielding 7.3% to maturity and are well secured by the increasing cash flows and the extensive asset base of the Company.
Mirabela Nickel 8.75% due April 15, 2018. Mirabela is a nickel producer with assets in Brazil. Mirabela endured the very strong headwind of lower global nickel prices. The price of the metal is down 36%, to $7.54 per pound, over the past two years. Mirabela's management has responded by lowering operating costs to adjust to this difficult environment, making Mirabela one of the lower cost producers. Using conservative estimates for operating costs and nickel prices in 2013, Mirabela should generate EBITDA of $50 million, which is enough to meet its interest payments of $40 million on its debt of $465 million. In addition, they currently have $140 million in cash on hand providing ample liquidity. Mirabela bonds mature in 2018 and are currently yielding 11.1%.
North American Energy Partners 9.125% due April 7, 2017. North American Energy provides a wide range of mining, heavy construction, industrial, and piling services to customers in the Canadian oil sands, mineral mining, commercial and public construction and conventional oil and gas markets. A new CEO, Martin Ferron, was appointed in June 2012. He has re-focused the business plan and cost structure, thereby improving margins, and has since sold the money losing pipeline business. As a result, EBITDA has improved to $70 million annualized and Deans Knight expect cash flows to continue to grow, as this only includes two quarters under new management. North American Energy currently has $330 million of total debt which, in addition to growing cash flows, is supported by a valuable heavy equipment asset base. The notes currently yield 9.7%.
DirectCash Payments Inc. 8.125% due August 8, 2019. DirectCash, a leading provider of ATMs, issued $200 million of debt in 2012 to fund the acquisition of Customer Limited, the largest provider of ATMs in Australia. Post-acquisition, DirectCash has a leading global ATM business, with the #1 market share in both Canada and Australia and the 3rd largest independent deployer of ATMs in the U.K. The Canadian market is currently well-served; however, growth should come from both Australia and the U.K. whose markets are relatively unsaturated. With the Customer Limited acquisition, DirectCash's pro forma EBITDA is $73 million and management has identified potential synergies, which should improve those cash flows further. DirectCash has a current market cap of $440 million, of which management owns 30%. DirectCash has stable, recurring revenue streams with a proven track record of growing cash flows. Bonds currently yield 7.2%.
We have two holdings in the portfolio that have significantly declined in value: Skylink Aviation (12.25% due March 15, 2016) and Northland Resources (13% due March 6, 2017).
In March 2011, the Company purchased second lien notes of Skylink Aviation. Skylink provides logistics services to Government and international organizations, with the majority of their revenue coming from contracts in Afghanistan. In 2012, management of Skylink were unable to adjust costs or replace revenues as the Canadian presence in Afghanistan was reduced, and Skylink could no longer support their debt. As a result, they filed for CCAA protection on March 8, 2013.
Deans Knight have been involved in the restructuring process, sit on the steering committee, and will be represented on the Board of Directors post restructuring. As part of the steering committee, we were in a position to backstop our pro rata share ($1.25 million) of an $18 million Debtor-In-Process (DIP) financing. The DIP allows Skylink to continue operations which was necessary to benefit the ultimate recovery of the second lien notes. The DIP financing is attractive as it has security over the Skylink's assets (specifically accounts receivable), earns a 10% coupon, and the providers of the DIP will own 75% of the equity. Although the total return on the DIP is not quantifiable at this time, Deans Knight anticipates it will generate an attractive return with equity upside and, therefore, will increase the recovery value for our second lien notes relative to the alternative scenario, which would be liquidation. Skylink notes were priced at $7 per $100 face value on March 31, 2013 and currently represent 0.3% of the portfolio. Given the current weight, the Skylink Notes will have minimal impact on the portfolio going forward, but we believe we will recover some value through the restructuring process.
In February 2012, the Company purchased first lien notes of Northland Resources, which produces a high grade iron ore concentrate from their Kaunisvaara project in Northern Sweden. In January 2013, Northlands Resources announced a funding shortfall at its Kaunisvaara mine and the need to raise approximately $400 million in additional capital. The unanticipated cost overruns destroyed confidence in management and fundraising efforts failed. As a result, Northland Resources filed for reconstruction, and a bondholder group formed to protect bondholders' interests. On May 3, 2013, bondholders approved a long-term restructuring solution whereby Northlands Resources will attempt to raise $362 million USD, via a first lien secured bond, to finance the development of the Kaunisvaara Project. If Northland Resources is successful in securing the financing, the full principal amount of our existing bonds will remain as outstanding debt as second lien convertible bonds, with a 4% Pay-In-Kind coupon, convertible into approximately 80% of the equity of the Company.
In late 2011, the Company participated in the $12 million secured notes financing to Conifex Timber Inc. to fund working capital. The notes paid a 12% coupon and were secured by the assets of Conifex, including sawmills in northern BC, in which they had already invested $80 million. In addition to the coupon, noteholders received a commitment fee of 2% and warrants to purchase 325,000 common shares. Since 2011, management has improved efficiencies and are now enjoying the benefits from the beginning of a housing industry recovery in the U.S. and consequent rising lumber prices. As a result of the improved outlook, Conifex secured a $25 million ABL facility with Royal Bank of Canada and repaid our $12 million Secured Notes on April 3, 2013. The annualized return on our investment, including commitment fees, was approximately 14.5% which excludes the potential further upside from the warrants financing. At March 31, 2013 the stock was trading at roughly $9, and the warrants have an exercise price of $9.33.
Detail of Net Asset Value:
The net asset value of the Company at March 31, 2013 was $141,473,822, or $13.43 per Share, which consisted of the following components:
| $ | Per Share (1) | % | ||||
| Investments (2) | 116,354,460 | 11.04 | 82.2 | |||
| Gain on forward contracts (3) | 55,491 | 0.01 | 0.0 | |||
| Cash and cash equivalents | 21,348,427 | 2.03 | 15.1 | |||
| Accrued Income | 2,651,892 | 0.25 | 1.9 | |||
| Future Income Tax Asset (4) | 1,710,000 | 0.16 | 1.2 | |||
| Accrued Liabilities net of prepaids | (646,448 | ) | (0.06 | ) | (0.4 | ) |
| 141,473,822 | 13.43 | 100.0 |
| Notes | |
| (1) | Based on 10,537,262 Shares, being the total number of voting and non-voting common shares outstanding during the period. |
| (2) | Details of the investments held at March 31, 2013 are included in the Summary of Investment Portfolio below. |
| (3) | Represents the mark-to-market gain (loss) on forward foreign currency contracts at March 31, 2013. The Company has hedged substantially all foreign denominated investments back to the Canadian Dollar. |
| (4) | The Company had approximately $24,760,000 of tax credits available to be applied against future years' income tax returns. The Company's policy is to recognize a future tax asset to the extent that it believes that it is more likely than not that the future tax asset will be realized. The Company will continue to review these estimates on a periodic basis and will amend the asset value accordingly, if deemed appropriate. |
Normal Course Issuer Bid
The Company is also pleased to announce that the Toronto Stock Exchange ("TSX") has accepted the Company's Notice of Intention to make a normal course issuer bid (the "NCIB"). Management of the Company believes that, from time to time, the market price of the common voting shares of the Company ("Common Shares") may not fully reflect the underlying value of the Common Shares and that at such times the purchase of Common Shares would be in the best interests of the Company. Such purchases will increase the proportionate interest of, and may be advantageous to, all remaining shareholders.
Under the NCIB, the Company may purchase for cancellation, from time to time, as the Company considers advisable, up to a maximum of 956,974 Common Shares or approximately ten percent (10%) of the public float of the Company's Common Shares as of May 9, 2013. Purchases of Common Shares will be made on the open market through the facilities of the TSX. The price which the Company will pay for any Common Shares purchased by it will be the prevailing market price of the Common Shares on the TSX at the time of such purchase. The actual number of Common Shares that may be purchased for cancellation and the timing of any such purchases will be determined by the Company. Under the NCIB, the Company is subject to a maximum purchase limitation such that the number of Common Shares purchased under the NCIB, cannot, when aggregated with all other purchases by the Company during the preceding 30 days, aggregate more than 203,832 Common Shares, representing 2 percent of the 10,191,592 outstanding Common Shares as of May 9, 2013.
The NCIB will begin effective as of May 17, 2013 and will terminate on April 30, 2014 or such earlier time as the NCIB is completed or terminated at the option of the Company. GMP Securities L.P. will act on the Corporation's behalf to make purchases of Common Shares pursuant to the NCIB.
About Deans Knight Income Corporation
Deans Knight Income Corporation is an investment company focused on investing in corporate debt securities, predominantly rated below investment grade. The Company's objective is to maximize the total return for shareholders, consisting of bond price appreciation and income received from bond investments. The Company intends to pay a monthly dividend to shareholders, based on earned income each month. The capital of the Company is actively managed by Deans Knight Capital Management, a respected investment firm based in Vancouver B.C. that has been investing in corporate bonds since its inception in 1992. For more information: www.dkincomecorp.com.
As an investment company, Deans Knight Income Corporation falls under the continuous disclosure requirements for investment funds. In compliance with such continuous disclosure requirements, the Company will provide shareholders with financial statements on a semi-annual basis. In an effort to keep shareholders informed, the Company intends to provide shareholders with an operational update each quarter, detailing relevant investment activity and holdings.
Forward-Looking Statements
This press release contains forward-looking statements. More particularly, this press release contains forward-looking statements concerning the Company's corporate objectives, availability of tax losses and deductions, the Company's expectations concerning market trends, the Company's intention to pay out earned income in the form of monthly dividends, the anticipated performance and characteristics of Deans Knight's portfolio companies, the intention to maintain a short term maturity, the Company's use of the NCIB and the yield on the Shares. Although the Company believes that the expectations reflected in these forward-looking statements are reasonable, undue reliance should not be placed on them because the Company can give no assurance that they will prove to be correct since forward-looking statements address future events and conditions and by their very nature, involve inherent risks and uncertainties. The forward-looking statements contained in this press release are made as of the date hereof and the Company disclaims any intention or obligation to update or revise any forward-looking statements whether as a result of new information, future events or otherwise, unless so required by applicable securities laws.
Summary of Investment Portfolio
The following is a summary of the Company's investment portfolio as at March 31, 2013. This is a summary only and will change due to ongoing portfolio transactions of the Company. Additional information is available at www.dkincomecorp.com.
| Top 25 Investments | ||||||||||
| % of Net Asset Value | Portfolio Composition | % of Net Asset Value | ||||||||
| PARAMOUNT RESOURCES | 8.250% | 13-Dec-17 | 6.7 | |||||||
| MIRABELA NICKEL LTD | 8.750% | 15-Apr-18 | 6.5 | Fixed Income | ||||||
| NORTH AMERICA ENERGY | 9.125% | 7-Apr-17 | 6.0 | Canadian denominated in CAD | 45.6 | |||||
| WHITECAP RESOURCES | N/A | N/A | 5.3 | Canadian denominated in USD | 15.5 | |||||
| CALFRAC HOLDINGS LP | 7.500% | 1-Dec-20 | 4.4 | United States denominated in USD | 12.7 | |||||
| SOUTHERN PACIFIC RES | 8.750% | 25-Jan-18 | 4.3 | Other Foreign denominated in USD | 1.9 | |||||
| TEMBEC INDUSTRIES | 11.250% | 15-Dec-18 | 3.4 | Other Foreign denominated in EUR | 0.9 | |||||
| PERPETUAL ENERGY INC | 8.750% | 15-Mar-18 | 3.4 | 76.6 | ||||||
| CCS INC | 11.000% | 15-Nov-15 | 3.3 | |||||||
| STONE ENERGY CORP | 8.625% | 1-Feb-17 | 3.3 | Equity and Warrants | 5.8 | |||||
| PETROAMERICA OIL | 11.500% | 19-Apr-20 | 2.8 | |||||||
| SHERRITT INTL CORP | 8.000% | 15-Nov-18 | 2.8 | Investment Portfolio | 82.4 | |||||
| CARA OPERATIONS LTD | 9.125% | 1-Dec-15 | 2.5 | Cash & Short-term Deposits | 15.1 | |||||
| BEAZER HOMES USA | 9.125% | 15-Jun-18 | 2.5 | Other Net Assets | 2.5 | |||||
| GARDA WORLD SECURITY | 9.750% | 15-Mar-17 | 2.4 | 100.0 | ||||||
| CONIFEX TIMBER INC | 12.000% | 31-Dec-13 | 2.1 | |||||||
| GATEWAY CASINOS | 8.875% | 15-Nov-17 | 2.1 | Sector Breakdown | ||||||
| BLACK PRESS GROUP | 10.000% | 4-Feb-14 | 1.9 | Energy | 48.3 | |||||
| NORTHLAND RESOURCES | 13.000% | 6-Mar-17 | 1.9 | Materials & Metals | 12.8 | |||||
| PACIFIC RUBIALES | 7.250% | 12-Dec-21 | 1.9 | Consumer Discretionary | 8.6 | |||||
| SURE ENERGY | 6.250% | 21-Jan-14 | 1.8 | Forestry | 6.5 | |||||
| WESTERN ENERGY SVS | 7.785% | 30-Jan-19 | 1.6 | Industrial/ Manufacturing | 4.5 | |||||
| 99 CENTS ONLY STORES | 11.000% | 15-Dec-19 | 1.5 | Technology | 0.9 | |||||
| SHERRITT INTL CORP | 7.500% | 24-Sep-20 | 1.4 | Services | 0.8 | |||||
| NIKO RESOURCE LTD CV | 7.000% | 13-Dec-17 | 1.4 | Investment Portfolio | 82.4 | |||||
| Cash & Short-term Deposits | 15.1 | |||||||||
| Other Net Assets | 2.5 | |||||||||
| 100.0 | ||||||||||
Contact Information:
Craig Langdon
Chief Executive Officer and Director
(604)669-0212
Deans Knight Income Corporation
Mark Myles
Chief Financial Officer
(604)669-0212
www.dkincomecorp.com