Same-store sales at NRS retailers during January increased 1.4% compared to January 2023
Compared to December 2023, same-store-sales per calendar day in January decreased 10.0% - reflecting, in part, the seasonal impact of robust holiday sales in December
The average prices for the most popular items sold in January increased 0.3% year-over-year
NEWARK, N.J., Feb. 07, 2024 (GLOBE NEWSWIRE) -- NRSInsights, a provider of sales data and analytics drawn from retail transactions processed through the National Retail Solutions (NRS) point-of-sale (POS) platform, today announced comparative same-store sales results for January 2024.
As of January 31, 2024, the NRS retail network comprised approximately 28,700 active terminals scanning purchases at independent retailers including bodegas, convenience stores, liquor stores, grocers, and tobacco and sundries sellers nationwide, predominantly serving urban consumers.
January Retail Same-Store Sales Highlights
(Same-store sales, unit sales and transaction data refer to January 2024 unless otherwise noted)
- Same-store sales increased 1.4% from a year earlier (January 2023). Average sales per calendar day decreased 10.0% compared to the preceding month, partly reflecting the seasonal impact of comparison to December’s holiday sales. In January 2023, average sales per calendar day decreased 6.0% compared to December 2022.
- Same-store sales in the preceding month (December 2023) had increased 5.5% compared to the year-ago month (December 2022). Average sales per calendar day in December 2023 had increased 5.3% compared to the preceding month (November 2023).
- For the three months ended January 31, 2024, same-store sales increased 2.9% compared to the three months ended January 31, 2023.
- The number of items sold increased 4.4% compared to a year earlier (January 2023). Items sold decreased 5.1% compared to December 2023 on a per calendar day basis reflecting, in part, the impact of December’s holiday sales.
- The average number of transactions per store decreased 0.6% compared to January 2023. The average number of transactions per calendar day decreased 6.6% compared to December 2023 again reflecting, in part, the impact of seasonality.
- A dollar-weighted average of prices for the top 500 items purchased in January 2024 increased 0.3% year-over-year, a decrease from the 1.2% year-over-year increase recorded in December 2023.
Commentary from Suzy Silliman (SVP, Data Strategy and Sales at NRS)
“Year-over-year same-store sales in our network increased 1.2% in January, continuing the trend toward slower growth we saw through much of 2023. January characteristically generates a sequential sales decrease, with tighter spending compared to the preceding holiday season.
“’Better for you’ resolutions influence the composition of shoppers' baskets during January, and that sentiment was especially strong this year. Tobacco/Tobacco Alternatives, Desserts, and Candy were among the categories experiencing higher than the typical ‘seasonal’ declines, while wellness categories including Vitamins and Supplements, Performance Nutrition, and Vegetables outpaced year-ago same store sales by double-digit percentages.
“Continuing on this theme, during “Dry January" 2024, both Non-Alcoholic Beer and Non-Alcoholic Spirits delivered sizable sales increases over the prior year. More non-alcoholic varieties are taking the shelf as they mainstream with consumers.
“Also of note, Upper Respiratory products saw a 24% increase over January 2023 in same stores scanning, reflecting the continued rise in RSV, flu and COVID-19 cases nationwide.
“Our stores’ retail customers got some good news in January. Inflationary pressure, as measured by the prices of the 500 most popular items sold across our network, continued to subside, slowing to a 0.3% year over year increase – the lowest figure since NRS began reporting same-store sales in July of 2022.
“NRS same-store sales again outperformed the broader retailer market as measured by the US Commerce Department’s most recent three month rolling average, even as the difference in their respective rates of increase continued to narrow.”
Retail Trade Comparative Data
The table below provides historical comparative data with the U.S. Commerce Department’s Advance Monthly Retail Trade same-store sales data excluding food service:
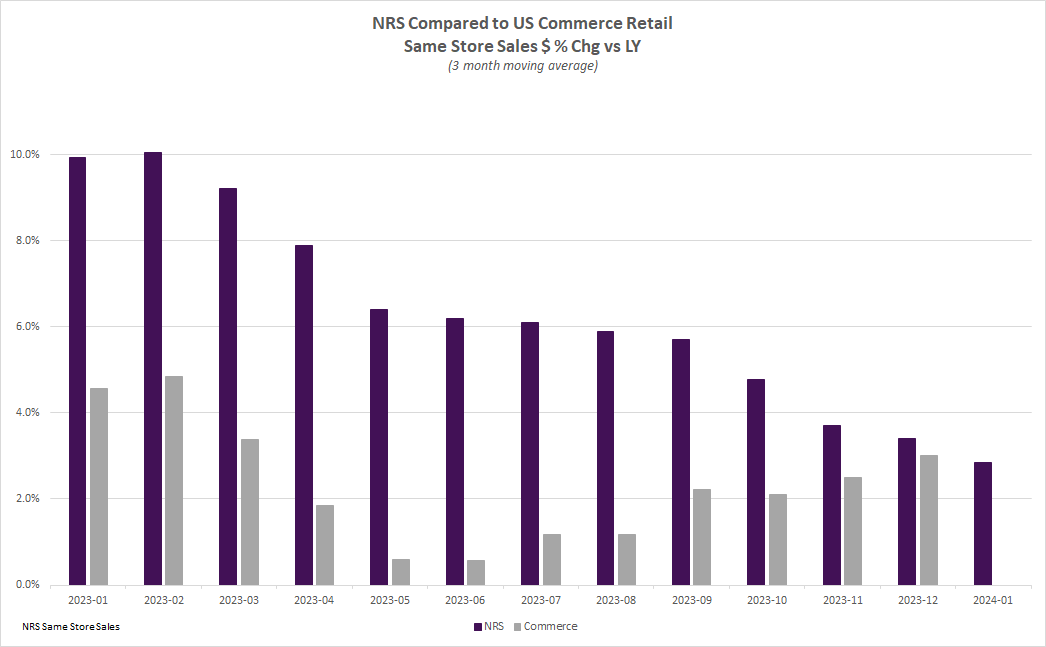
Over the past twelve months, the NRS network’s three-month moving average same-store sales have outpaced the US Commerce Department’s Advance Monthly Retail Trade data excluding food services by 4.3% percentage points, on average.
The NRSInsights data have not been adjusted to reflect inflation, demographic distributions, seasonal buying patterns, item substitution, or other factors that may facilitate comparisons to other periods, to other same-store retail sales data, or to the U.S. Commerce Department’s retail data.
NRSInsights Reports
The NRSInsights monthly Same-Store Retail Sales Reports are intended to provide timely topline data reflective of sales at NRS’ network of independent, predominantly urban, retail stores.
Same-store data comparisons of January 2024 with January 2023 are derived from approximately 153 million transactions processed through the 16,547 stores on the NRS network that scanned transactions in both months. Same-store data comparisons of January 2024 with December 2023 are derived from approximately 207 million transactions processed through 23,876 stores.
Same-store data comparisons for the three months ended January 31, 2024 with the year-ago three months are derived from approximately 447 million scanned transactions processed through the stores that were in the NRS network in both quarters.
NRS POS Network
The NRS network comprises approximately 28,700 active POS terminals operating in approximately 24,900 independent retail stores. Its platform predominantly serves small-format, independent, retail stores including convenience stores, bodegas, liquor stores, grocers, tobacco and sundries sellers. The network includes retailers in all 50 states and in 196 of the 210 designated market areas (DMAs) in the United States. Over the past twelve months, NRS’ POS terminals have processed $17.5 billion in sales through approximately 1.2 billion transactions.
About National Retail Solutions (NRS):
National Retail Solutions operates the largest point-of-sale (POS) terminal-based platform and digital payment processing service for independent retailers nationwide. Retailers utilize NRS offerings to process transactions and effectively manage their businesses. Consumer packaged goods (CPG) suppliers, brokers, analytics firms, and advertisers access the terminal’s digital display network to reach these retailers’ predominantly urban, multi-cultural shopper base, and to harness transaction data-based learnings to identify growth opportunities and measure execution and returns on marketing investment. NRS is a subsidiary of IDT Corporation (NYSE: IDT).
All statements above that are not purely about historical facts, including, but not limited to, those in which we use the words “believe,” “anticipate,” “expect,” “plan,” “intend,” “estimate,” “target” and similar expressions, are forward-looking statements within the meaning of the Private Securities Litigation Reform Act of 1995. While these forward-looking statements represent our current judgment of what may happen in the future, actual results may differ materially from the results expressed or implied by these statements due to numerous important factors. Our filings with the SEC provide detailed information on such statements and risks, and should be consulted along with this release. To the extent permitted under applicable law, IDT assumes no obligation to update any forward-looking statements.
NRSInsights Contact:
Suzy Silliman
SVP, Data Strategy and Sales at NRS
National Retail Solutions
suzy.silliman@nrsplus.com
suzy.silliman@nrsplus.comIDT Corporation Contact:
Bill Ulrey
william.ulrey@idt.net
# # #
