HIGHLIGHTS
- The Eureka West and Eureka East deposits reported in the maiden 2023 Mineral Resource Estimate (“MRE”) are now connected as one deposit measuring 4.5 kilometers (2.8 miles) in length.
- Relative to the maiden MRE:
- A significant portion of the deposit was upgraded from Inferred to Indicated MRE. Previously there was 0 tonnes of Indicated resource. There has been an addition of 813 million tonnes of Indicated resource to the MRE.
- The grade of the Indicated resource is 0.29% nickel equivalent (“NiEq”).
- The Inferred resource has increased from 319.6 million tonnes to 896 million tonnes, a 180% increase. The grade of the Inferred resource is 0.27% NiEq.
- There has been an addition of 3.877 billion pounds (1.758 million tonnes) of contained nickel to the Indicated resource.
- There has been an increase in Inferred resource contained nickel metal from 1.552 billion pounds (703,975 tonnes) to 4.225 billion pounds (1.916 million tonnes), a 172% increase.
- As a consequence of joining the two deposits together, the strip ratio has been reduced from 3.7:1 to 1.5:1. Three parallel zones of mineralization are now identified (EZ1, EZ2, and EZ3).
- A higher-grade core zone has been identified within EZ2 and it shows continuity along much of the strike of the deposit. The higher-grade core contains an Indicated resource of 211 million tonnes at a grade of 0.34% NiEq and an Inferred resource of 154 million tonnes at a grade of 0.33% NiEq.
| THE MRE now stands at: | ||
| Indicated MRE: | ||
| 813 | million tonnes grading 0.29% NiEq containing: | |
| 3,877 | million pounds (1.758 million tonnes) of nickel | |
| 1,276 | million pounds (578,783 tonnes) of copper | |
| 303 | million pounds (137,438 tonnes) of cobalt | |
| 4.0 | million ounces of platinum, plus palladium and gold | |
| Inferred MRE: | ||
| 896 | million tonnes grading 0.27% NiEq containing: | |
| 4,225 | million pounds (1.916 million tonnes) of nickel | |
| 1,040 | million pounds (471,736 tonnes) of copper | |
| 327 | million pounds (148,324 tonnes) of cobalt | |
| 3.4 | million ounces of platinum, plus palladium and gold | |
VANCOUVER, British Columbia, Feb. 12, 2024 (GLOBE NEWSWIRE) -- Energy Metals Corporation (TSX-V: AEMC, OTCQB: AKEMF) (“AEMC” or the “Company”) announced today an updated independent mineral resource estimate prepared in accordance with National Instrument 43-101 Standards of Disclosure for Mineral Projects (“NI 43-101”) (“2024 MRE” or “2024 Resource”) for its 100% owned Eureka Deposit, Nikolai Nickel Project (“Nikolai” or “Deposit”) in Alaska, USA, with an effective date of February 12, 2023.
The newly-published 2024 MRE contains an addition of 813 million tonnes of indicated resource, 896 million tonnes of inferred resource (an increase of 180%), and a strip ratio decrease, when compared with the maiden resource published in 2023 (see press release dated November 20, 2023). The study was completed by Stantec Consulting Services, Inc., and includes 35 historical drill holes, the data for which the Company purchased in August 2023, and eight diamond drill holes (totaling 4,138 meters) drilled by the Company on the project in 2023.
Alaska Energy Metals President & CEO Gregory Beischer commented, “In less than a year, we have taken an exploration concept to a substantial deposit of nickel and other critical metals. The mineral resource estimate update has produced a 180% increase in the Inferred tonnage, and added substantial, new Indicated tonnage to the deposit. The update increases the nickel metal content of the deposit to over 8 billion pounds (more than 3.7 million metric tonnes) with only a 0.01% grade decrease and a notably lower strip ratio. With this updated mineral resource estimate, the Eureka deposit of the Nikolai Nickel project represents a globally significant accumulation of nickel and has now become one of the larger known nickel deposits in the United States. Nikolai could potentially become an important source of nickel for the USA, catering to the needs of various manufacturing sectors including stainless steel, electric vehicles, defense components, long-term, grid-scale renewable energy storage batteries and a myriad of other uses. This significant achievement speaks volumes to the hard work our team has put into the project over the past year. I am particularly encouraged by the delineation of a higher-grade core zone. The presence of this core zone could dramatically affect project economics in a positive way.”
Nikolai Mineral Resource Estimate Update
- Total Indicated mineral resources of 3.877 billion pounds (1.758 million tonnes) of nickel, 1.276 billion pounds (578,783 tonnes) of copper, and 303 million pounds (137,438 tonnes) of cobalt, plus a total of 4.0 million ounces of platinum, plus palladium and gold in a constrained model totaling 813 million tonnes, at an average grade of 0.29% total NiEq, using a 0.20% NiEq cut-off grade. See detailed breakdown in Tables 1, 2, and 3 below.
- Total Inferred mineral resources of 4.225 billion pounds (1.916 million tonnes) of nickel, 1.040 billion pounds (471,736 tonnes) of copper, and 327 million pounds (148,324 tonnes) of cobalt, plus a total of 3.4 million ounces of platinum, plus palladium and gold in a constrained model totaling 896 million tonnes, at an average grade of 0.27% total NiEq, using a 0.20% NiEq cut-off grade. See detailed breakdown in Tables 1, 2, and 3 below.
- A higher-grade core zone has been identified within EZ2, and it shows continuity along much of the strike of the deposit. The higher-grade core contains an Indicated resource of 211 million tonnes at a grade of 0.34% NiEq and an Inferred resource of 154 million tonnes at a grade of 0.33% NiEq. This zone will continue to be evaluated, as it could positively affect project economics
- The 2024 MRE represents a significant, material tonnage increase in the MRE for the Nikolai Nickel project compared to the maiden MRE (see press release dated November 20, 2023).
- The 2024 MRE is defined by 43 drill holes comprising 35 historic and eight holes drilled in 2023 by AEMC. The drill holes provide confirmation that mineralization is interconnected across all three domains. The deposits remain open along strike and in the down dip direction.
- The 2024 MRE incorporates three zones (EZ1, EZ2, EZ3) of sulfide mineralization that cover 4.5 kilometers (2.8 miles) of the Eureka deposit (Figure 1). The Eureka Zone East and Eureka Zone West MRE reported in the 2023 maiden MRE are now connected to form one continuous deposit.
- As a consequence of joining the two deposits together, the strip ratio was significantly decreased from 3.7:1 to 1.5:1.
- Chrome and iron are also present within the deposit but have not been reported in the 2024 Resource due to the lack of historical assay data and analytical methods used.
The 2024 MRE will be incorporated into a NI 43-101 compliant technical report for the Nikolai Nickel project to be filed within 45 days.
| Table 1 – Nikolai Project Mineral Resource Estimate (MRE) Effective February 12, 2024 | ||||||||||
| Indicated Mineral Resource Tonnes and Grade | ||||||||||
| Area | Mineralized Zone | NiEq Cutoff | Tonnage | Base and Battery Metals | PGM and Precious Metals | Total | ||||
| Ni | Cu | Co | Pt | Pd | Au | NiEq* | ||||
| (%) | (MT) | (%) | (%) | (%) | (g/T) | (g/T) | (g/T) | (%) | ||
| Eureka | Eureka Zone 1 (EZ1) | >= 0.200 | - | - | - | - | - | - | - | - |
| Eureka Zone 2 (EZ2) | >= 0.200 | 739 | 0.22 | 0.08 | 0.02 | 0.049 | 0.101 | 0.013 | 0.29 | |
| Eureka Zone 3 (EZ3) | >= 0.200 | 74 | 0.21 | 0.02 | 0.02 | 0.035 | 0.023 | 0.006 | 0.25 | |
| Total | EZ1 + EZ2 + EZ3 | >= 0.200 | 813 | 0.22 | 0.07 | 0.02 | 0.048 | 0.094 | 0.012 | 0.29 |
| Indicated Mineral Resource Tonnes and Metal Content | ||||||||||
| Area | Mineralized Zone | NiEq Cutoff | Tonnage | Base and Battery Metals | PGM and Precious Metals | Total | ||||
| Ni | Cu | Co | Pt | Pd | Au | NiEq* | ||||
| (%) | (MT) | (Mlbs) | (Mlbs) | (Mlbs) | (KtOz) | (KtOz) | (KtOz) | (Mlbs) | ||
| Eureka | Eureka Zone 1 (EZ1) | >= 0.200 | - | - | - | - | - | - | - | - |
| Eureka Zone 2 (EZ2) | >= 0.200 | 739 | 3,532 | 1,243 | 279 | 1,166 | 2,400 | 310 | 4,770 | |
| Eureka Zone 3 (EZ3) | >= 0.200 | 74 | 345 | 33 | 25 | 83 | 54 | 15 | 407 | |
| Total | EZ1 + EZ2 + EZ3 | >= 0.200 | 813 | 3,877 | 1,276 | 303 | 1,249 | 2,454 | 326 | 5,177 |
| Inferred Mineral Resource Tonnes and Grade | ||||||||||
| Area | Mineralized Zone | NiEq Cutoff | Tonnage | Base and Battery Metals | PGM and Precious Metals | Total | ||||
| Ni | Cu | Co | Pt | Pd | Au | NiEq* | ||||
| (%) | (MT) | (%) | (%) | (%) | (g/T) | (g/T) | (g/T) | (%) | ||
| Eureka | Eureka Zone 1 (EZ1) | >= 0.200 | 85 | 0.19 | 0.02 | 0.02 | 0.025 | 0.020 | 0.004 | 0.22 |
| Eureka Zone 2 (EZ2) | >= 0.200 | 693 | 0.22 | 0.06 | 0.02 | 0.042 | 0.082 | 0.010 | 0.28 | |
| Eureka Zone 3 (EZ3) | >= 0.200 | 118 | 0.21 | 0.02 | 0.02 | 0.033 | 0.022 | 0.006 | 0.25 | |
| Total | EZ1 + EZ2 + EZ3 | >= 0.200 | 896 | 0.21 | 0.05 | 0.02 | 0.039 | 0.068 | 0.009 | 0.27 |
| Inferred Mineral Resource Tonnes and Metal Content | ||||||||||
| Area | Mineralized Zone | NiEq Cutoff | Tonnage | Base and Battery Metals | PGM and Precious Metals | Total | ||||
| Ni | Cu | Co | Pt | Pd | Au | NiEq* | ||||
| (%) | (MT) | (Mlbs) | (Mlbs) | (Mlbs) | (KtOz) | (KtOz) | (KtOz) | (Mlbs) | ||
| Eureka | Eureka Zone 1 (EZ1) | >= 0.200 | 85 | 356 | 31 | 29 | 67 | 56 | 10 | 422 |
| Eureka Zone 2 (EZ2) | >= 0.200 | 693 | 3,320 | 957 | 259 | 939 | 1,831 | 233 | 4,337 | |
| Eureka Zone 3 (EZ3) | >= 0.200 | 118 | 549 | 52 | 39 | 127 | 85 | 22 | 647 | |
| Total | EZ1 + EZ2 + EZ3 | >= 0.200 | 896 | 4,225 | 1,040 | 327 | 1,133 | 1,972 | 265 | 5,406 |
- NiEq = nickel equivalent, MT = million tonnes, Mlb = Million pounds, KtOz = thousand troy ounces.
- Totals may vary due to rounding.
- CIM definitions are followed for classification of Mineral Resource.
- Metal pricing used to calculate NiEq is based on observation of monthly metal pricing for the past 24 months up to end-January 2024 with Ni at US$23,375/tonne (US$10.6/lb) (World Bank), Cu at US$ 8,644/tonne ($US3.92/lb) (World Bank), Co 41,050 US$/tonne (US18.62/lb) (Trading Economics), Pt at US$963/toz (World Bank), Pd at US$1,664/toz (Kitco), and Au at 1,878 (World Bank). Totals may not represent the sum of the parts due to rounding.
- Nickel equivalent grade formula is as follows:
*NiEq = (Ni%) + (Cu% * 0.31) + (Co% * 1.46) + (Pt% * 1,103) + (Pd% * 1,907) + (Au% * 2,153)
Coefficients used to calculate the value of other metals to Ni equivalent include allowances for differences in assumed recoveries of other metals (50%) and nickel (60%), and are calculated as follows:
(Metal Price)/(Ni Price) x (metal recovery/Ni recovery). - Base case NiEq cutoff grade is 0.20% calculated from a Ni price of US$23,375/tonne (US$10.60 US$/lb), surface mining cost of US$2.50 per tonne, processing costs US$25.00 per tonne and Ni recovery of 60% and 50% for other metals (Cu, Co, Pt, Pd, and Au).
- Mineral Resource are reported from within an economic pit shell whose extent has been estimated using a Ni price of US$23,374.56/tonne (US$10.60 US$/lb) and mining cost of US$2.50 per tonne, from a Ni equivalent grade calculated from Ni, Cu, Co, Pt, Pd, and Au, and 45-degree constant slope angle.
- The Mineral Resource estimate has been prepared by Derek Loveday, P. Geo. of Stantec Consulting Services Inc. in conformity with CIM “Estimation of Mineral Resource and Mineral Reserves Best Practices” guidelines and are reported in accordance with the Canadian Securities Administrators NI 43-101. Mineral resources are not mineral reserves and do not have demonstrated economic viability. There is no certainty that any mineral resource will be converted into mineral reserve.
SENSITIVITY ANALYSIS
A sensitivity analysis for Indicated and Inferred mineral resources are provided in Table 2 and Table 3 respectively, which demonstrates the variation in grade and tonnage in the deposit at various cut-off grades. Constrained Mineral Resources are reported at a base case cut-off grade of 0.20% NiEq. The values in the table reported above and below the cut-off grades should not be misconstrued with a Mineral Resource Statement. The values are only presented to show the sensitivity of the block model estimates to the selection of cut-off grade. All figures are rounded to reflect the relative accuracy of the estimate.
| Table 2 – Nikolai Project MRE Indicated Grade Sensitivity Effective February 12, 2024 | ||||||||||
| Indicated Mineral Resource Tonnes and Grade Sensitivity | ||||||||||
| Area | Mineralized Zone | NiEq Cutoff | Tonnage | Base and Battery Metals | PGM and Precious Metals | Total | ||||
| Ni | Cu | Co | Pt | Pd | Au | Ni Eq* | ||||
| (%) | (MT) | (%) | (%) | (%) | (g/T) | (g/T) | (g/T) | (%) | ||
| Total | EZ1+ EZ2 + EZ3 | >= 0.100 | 892 | 0.21 | 0.07 | 0.02 | 0.05 | 0.09 | 0.01 | 0.28 |
| >= 0.150 | 891 | 0.21 | 0.07 | 0.02 | 0.05 | 0.09 | 0.01 | 0.28 | ||
| >= 0.200 | 813 | 0.22 | 0.07 | 0.02 | 0.05 | 0.09 | 0.01 | 0.29 | ||
| >= 0.225 | 735 | 0.22 | 0.08 | 0.02 | 0.05 | 0.10 | 0.01 | 0.30 | ||
| >= 0.250 | 618 | 0.23 | 0.08 | 0.02 | 0.05 | 0.11 | 0.01 | 0.31 | ||
| >= 0.275 | 467 | 0.24 | 0.09 | 0.02 | 0.06 | 0.12 | 0.02 | 0.32 | ||
| >= 0.300 | 289 | 0.25 | 0.11 | 0.02 | 0.07 | 0.14 | 0.02 | 0.34 | ||
| >= 0.325 | 177 | 0.26 | 0.13 | 0.02 | 0.07 | 0.16 | 0.02 | 0.37 | ||
| >= 0.350 | 114 | 0.26 | 0.14 | 0.02 | 0.08 | 0.17 | 0.02 | 0.38 | ||
| >= 0.375 | 70 | 0.27 | 0.15 | 0.02 | 0.08 | 0.18 | 0.02 | 0.39 | ||
| >= 0.400 | 22 | 0.28 | 0.16 | 0.02 | 0.08 | 0.18 | 0.03 | 0.41 | ||
| Indicated Mineral Resource Tonnes and Metal Content Grade Sensitivity | ||||||||||
| Area | Mineralized Zone | NiEq Cutoff | Tonnage | Base and Battery Metals | PGM and Precious Metals | Total | ||||
| Ni | Cu | Co | Pt | Pd | Au | Ni Eq* | ||||
| (%) | (MT) | (Mlbs) | (Mlbs) | (Mlbs) | (KtOz) | (KtOz) | (KtOz) | (Mlbs) | ||
| Total | EZ2 + EZ2 + EZ3 | >= 0.100 | 892 | 4,126 | 1,326 | 330 | 1,326 | 2,539 | 347 | 5,502 |
| >= 0.150 | 891 | 4,123 | 1,324 | 329 | 1,325 | 2,535 | 347 | 5,498 | ||
| >= 0.200 | 813 | 3,877 | 1,276 | 303 | 1,249 | 2,454 | 326 | 5,177 | ||
| >= 0.225 | 735 | 3,593 | 1,218 | 277 | 1,167 | 2,345 | 305 | 4,815 | ||
| >= 0.250 | 618 | 3,113 | 1,102 | 236 | 1,033 | 2,121 | 273 | 4,195 | ||
| >= 0.275 | 467 | 2,434 | 934 | 183 | 851 | 1,773 | 227 | 3,320 | ||
| >= 0.300 | 289 | 1,569 | 693 | 117 | 616 | 1,290 | 162 | 2,195 | ||
| >= 0.325 | 177 | 995 | 501 | 75 | 423 | 896 | 115 | 1,426 | ||
| >= 0.350 | 114 | 662 | 358 | 50 | 292 | 620 | 81 | 961 | ||
| >= 0.375 | 70 | 415 | 234 | 31 | 185 | 393 | 52 | 606 | ||
| >= 0.400 | 22 | 135 | 76 | 10 | 57 | 125 | 18 | 197 | ||
| Table 3 – Nikolai Project MRE Inferred Grade Sensitivity Effective February 12, 2024 | ||||||||||
| Inferred Mineral Resource Tonnes and Grade Sensitivity | ||||||||||
| Area | Mineralized Zone | NiEq Cutoff | Tonnage | Base and Battery Metals | PGM and Precious Metals | Total | ||||
| Ni | Cu | Co | Pt | Pd | Au | Ni Eq* | ||||
| (%) | (MT) | (%) | (%) | (%) | (g/T) | (g/T) | (g/T) | (%) | ||
| Total | EZ1+ EZ2 + EZ3 | >= 0.100 | 1,089 | 0.20 | 0.05 | 0.02 | 0.04 | 0.06 | 0.01 | 0.26 |
| >= 0.150 | 1,076 | 0.20 | 0.05 | 0.02 | 0.04 | 0.06 | 0.01 | 0.26 | ||
| >= 0.200 | 896 | 0.21 | 0.05 | 0.02 | 0.04 | 0.07 | 0.01 | 0.27 | ||
| >= 0.225 | 752 | 0.22 | 0.06 | 0.02 | 0.04 | 0.08 | 0.01 | 0.29 | ||
| >= 0.250 | 603 | 0.23 | 0.06 | 0.02 | 0.04 | 0.08 | 0.01 | 0.30 | ||
| >= 0.275 | 413 | 0.24 | 0.07 | 0.02 | 0.05 | 0.09 | 0.01 | 0.31 | ||
| >= 0.300 | 244 | 0.25 | 0.08 | 0.02 | 0.05 | 0.11 | 0.01 | 0.33 | ||
| >= 0.325 | 124 | 0.26 | 0.10 | 0.02 | 0.06 | 0.12 | 0.01 | 0.35 | ||
| >= 0.350 | 46 | 0.26 | 0.14 | 0.02 | 0.08 | 0.16 | 0.02 | 0.38 | ||
| >= 0.375 | 26 | 0.27 | 0.16 | 0.02 | 0.08 | 0.18 | 0.03 | 0.39 | ||
| >= 0.400 | 10 | 0.28 | 0.16 | 0.02 | 0.08 | 0.18 | 0.03 | 0.41 | ||
| Inferred Mineral Resource Tonnes and Metal Content Grade Sensitivity | ||||||||||
| Area | Mineralized Zone | NiEq Cutoff | Tonnage | Base and Battery Metals | PGM and Precious Metals | Total | ||||
| Ni | Cu | Co | Pt | Pd | Au | Ni Eq* | ||||
| (%) | (MT) | (Mlbs) | (Mlbs) | (Mlbs) | (KtOz) | (KtOz) | (KtOz) | (Mlbs) | ||
| Total | EZ2 + EZ2 + EZ3 | >= 0.100 | 1,089 | 4,840 | 1,133 | 393 | 1,285 | 2,093 | 298 | 6,178 |
| >= 0.150 | 1,076 | 4,810 | 1,127 | 389 | 1,278 | 2,087 | 297 | 6,139 | ||
| >= 0.200 | 896 | 4,225 | 1,040 | 327 | 1,133 | 1,972 | 265 | 5,406 | ||
| >= 0.225 | 752 | 3,685 | 959 | 277 | 981 | 1,824 | 234 | 4,733 | ||
| >= 0.250 | 603 | 3,054 | 847 | 227 | 825 | 1,614 | 201 | 3,949 | ||
| >= 0.275 | 413 | 2,183 | 665 | 160 | 617 | 1,244 | 151 | 2,854 | ||
| >= 0.300 | 244 | 1,354 | 449 | 98 | 405 | 825 | 94 | 1,788 | ||
| >= 0.325 | 124 | 717 | 268 | 52 | 232 | 476 | 57 | 965 | ||
| >= 0.350 | 46 | 264 | 144 | 19 | 114 | 239 | 34 | 382 | ||
| >= 0.375 | 26 | 155 | 93 | 11 | 72 | 151 | 22 | 228 | ||
| >= 0.400 | 10 | 58 | 34 | 4 | 24 | 56 | 8 | 85 | ||
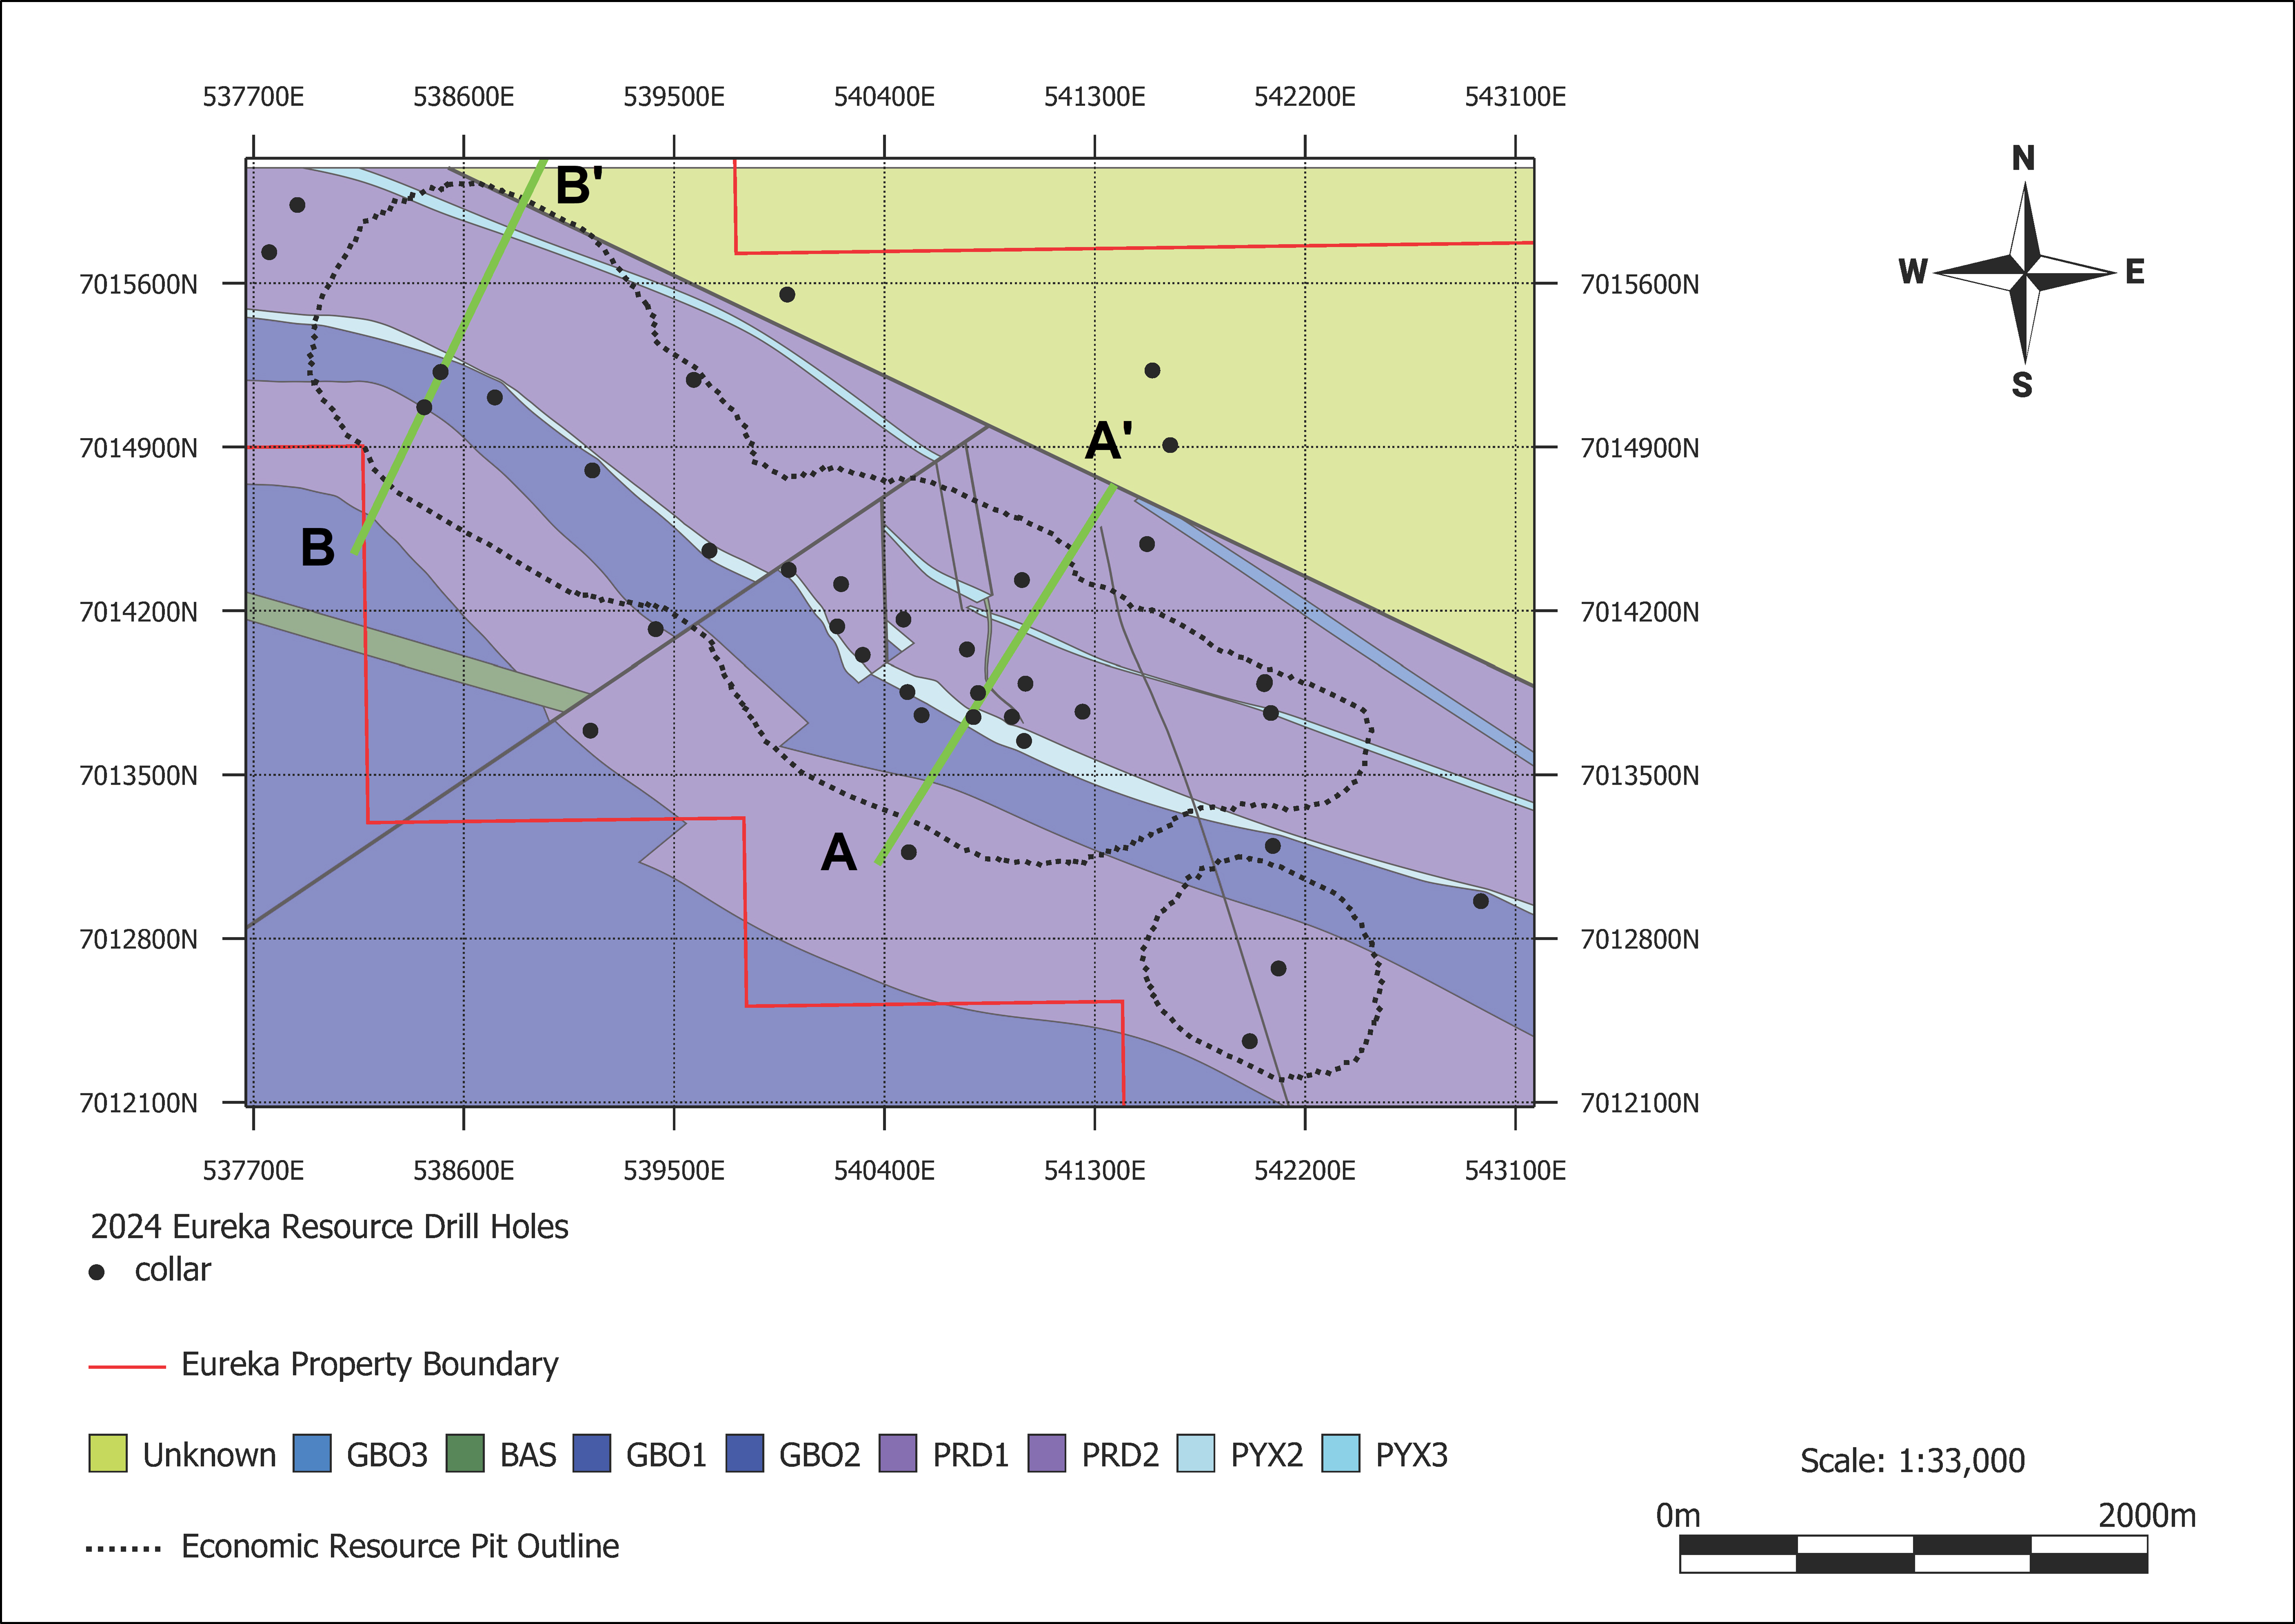
Figure 1. Eureka Zone overview map displaying geology, the 2024 economic resource pit outline, and drill hole locations.
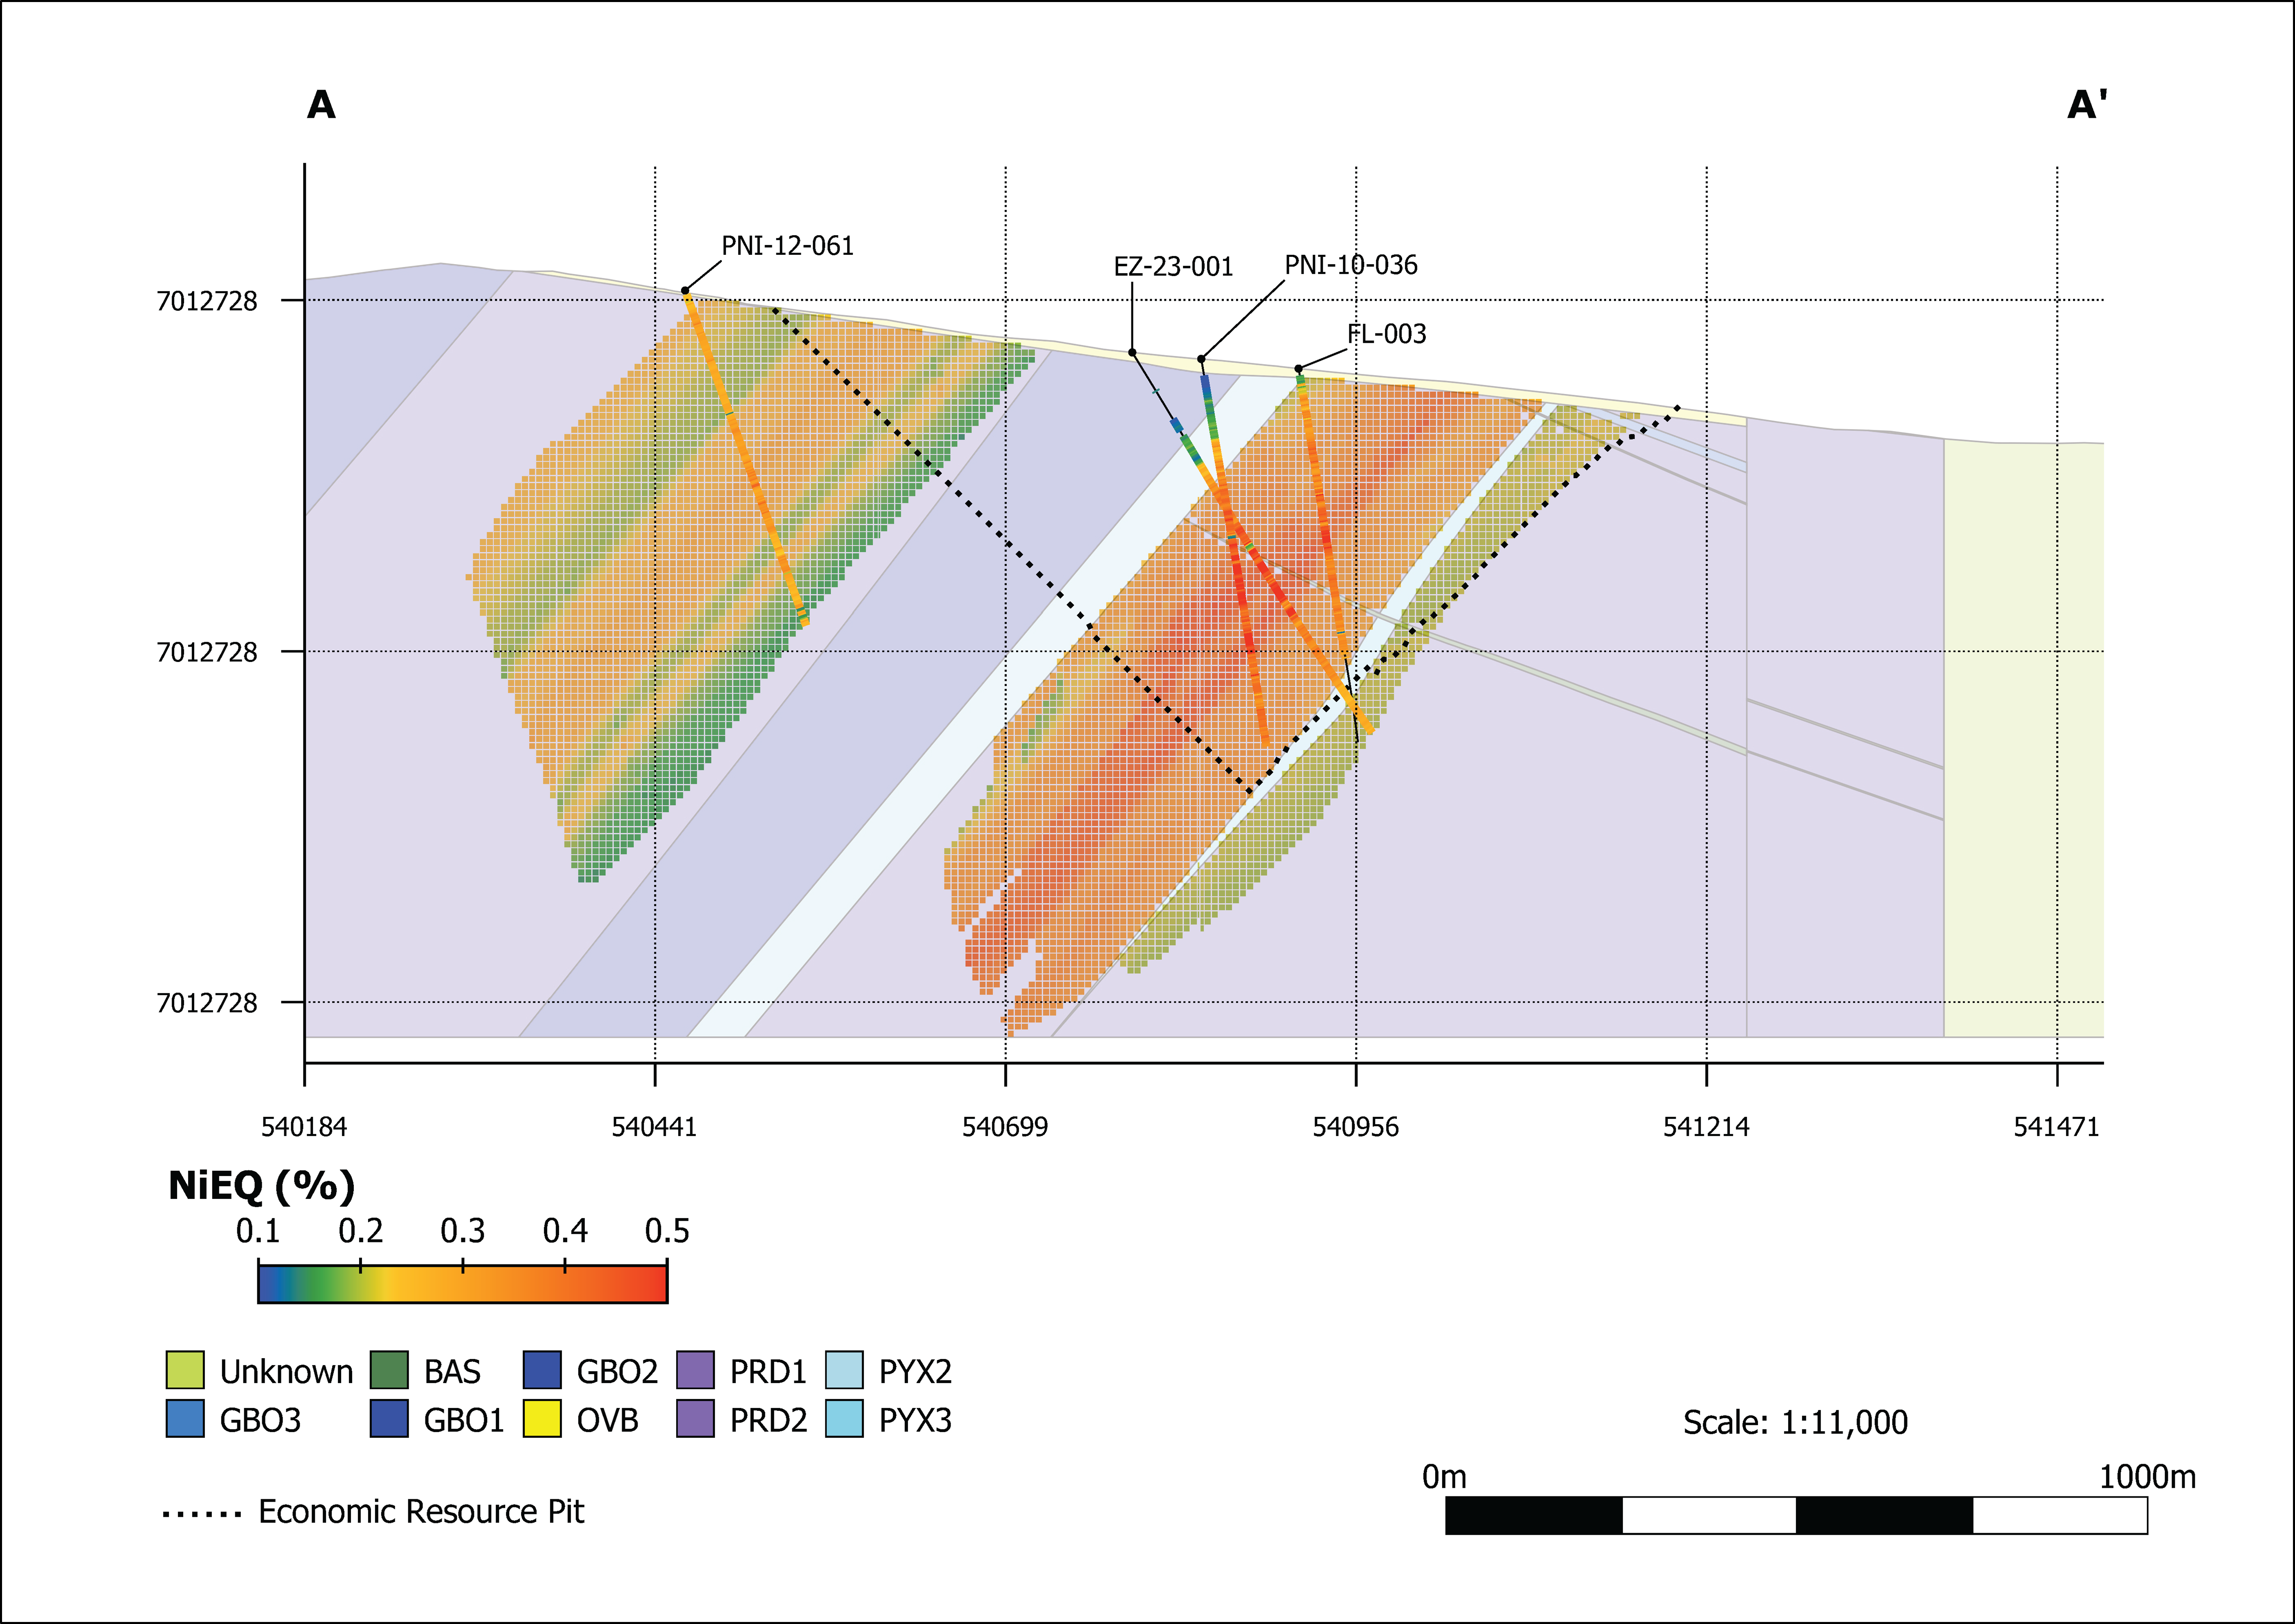
Figure 2. Cross section through the Eureka EZ1, EZ2, and EZ3 MRE. Note: Location of section A-A’ is located on Figure 1.
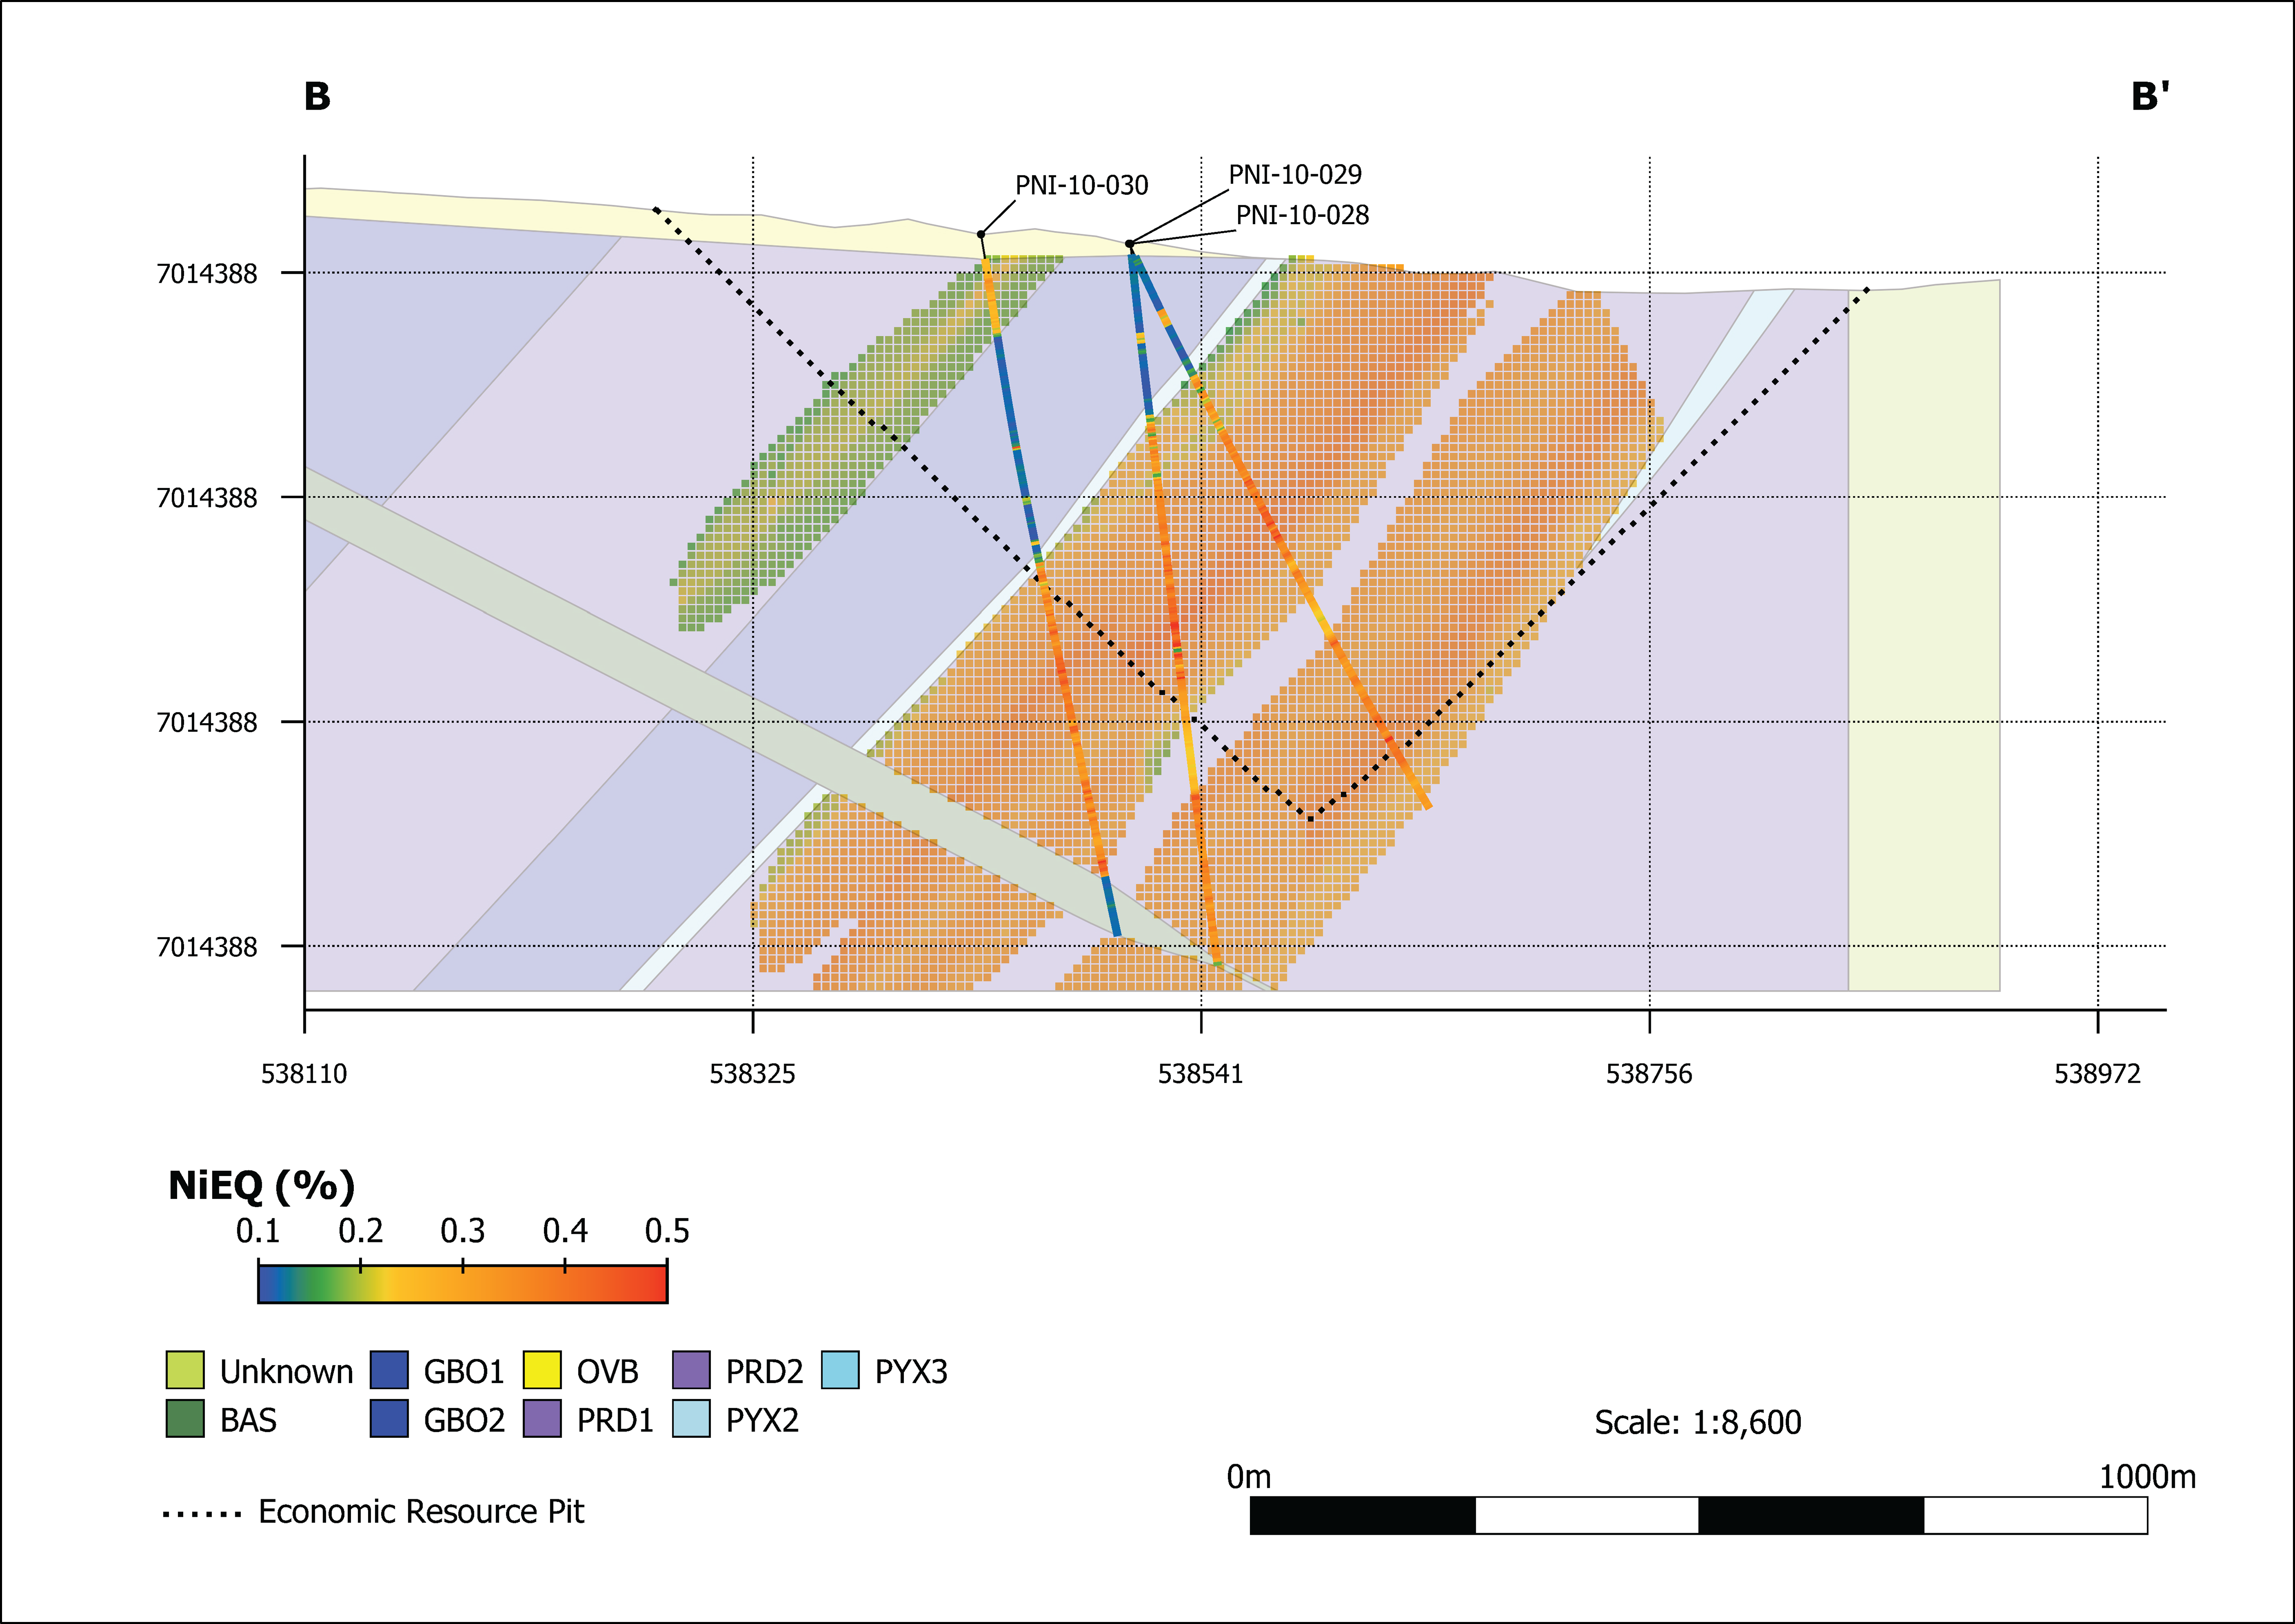
Figure 3. Cross section through the Eureka EZ1, EZ2 & EZ3 MRE. Note: Location of section B-B’ is located on Figure 1.
MINERAL RESOURCE ESTIMATION CALCULATION METHODOLOGY
The geologic model used for reporting of mineral resources is a 3D block model that was developed using LeapFrog Edge version 2023.1.1 and MinePlan version 16.1.1. The block model was developed using the UTM NAD83 6N and is in metric units. The block size is 40 m (X), 10 m (Y) and 10 m (Z) rotated by 26 degrees toward the east to align the X-axis along strike at 118 degrees. The block model captures three mineralized ultramafic intrusive bodies (“zones” or “solids”) that dip towards the southwest at between 45° and 50°. These three zones are called Eureka Zone 1 (EZ1), Eureka Zone 2 (EZ2) and Eureka Zone 3 (EZ3) from south to north across the deposit, respectively. The mineralized zones were built using Seequent’s Leapfrog Geo software from a drillhole database of 43 drillholes. Mineral sample assays have been validated for 36 of the 43 drillholes and assay data from these holes has been used to estimate grades for nickel (Ni), copper (Cu), cobalt (Co), platinum (Pt), palladium (Pd), gold (Au), silver (Ag), iron (Fe) and chromium (Cr). All metals, excluding Ag, Fe and Cr, have been used to calculate a NiEq grade based on average (24 month) market prices. Ag and Au grades were capped prior to estimation at 0.6 parts per million (ppm) for Ag and 0.03 ppm for Au within EZ1. Ni is approximately 77% of the total in-situ value of the metals included in the equivalent grade calculation.
Reasonable prospects for economic extraction have been determined by calculating a recovered NiEq cutoff grade of 0.20 percent (%) using the following assumptions:
- Mining costs US$2.5/tonne;
- Processing costs US$25/tonne;
- Processing recovery of 60%.
Resources are reported from within an economic pit shell at a 45-degree constant slope using Hexagon mining Pseudoflow algorithm. No underground mining is considered. Assumed revenue used to drive the pit shell is US$10.60/lb Ni applied to a recovered Ni-equivalent grade assuming 60% recovery for Ni and 50% recovery for all other metal equivalents. This pit optimization does not represent an economic study. Future engineering studies will be needed to develop optimal bulk tonnage mining methods. The pit-constrained MRE is at an indicated and inferred-level of assurance based in the quantity of exploration data available for grade estimation. Mineral resources are reported for the EZ1, EZ2 and EZ3.
The Nikolai Project MRE, with an effective date of February 12, 2024, is shown in Table 1 and associated grade sensitivity is shown in Table 2 and Table 3.
MINERAL RESOURCE ESTIMATE PREPARATION
The 2024 MRE has been prepared by Derek Loveday, P. Geo. (the “QP”) of Stantec Consulting Services Inc. in conformity with CIM “Estimation of Mineral Resource and Mineral Reserves Best Practices” guidelines and are reported in accordance with NI 43-101. The QP is not aware of any environmental, permitting, legal, title, taxation, socio‐economic, marketing, political, or other relevant issues that could potentially affect the 2024 MRE. Mineral resources are not mineral reserves and do not have demonstrated economic viability. There is no certainty that any mineral resource will be converted into mineral reserve.
METALLURGY
All deposits in the 2024 Resource contain desirable nickel sulfide mineralization consisting of thick, layered horizons of nickel and copper sulfides, which are enriched in cobalt, chrome, iron, platinum, palladium, and gold. Preliminary deportment assessments for the Eureka Zone 2 mineralization have been completed by Pure Nickel Inc. in 2014 (see Pure Nickel’s press release dated April 22, 2014) and by the Company in 2022 (see press release dated September 29, 2022). Results from these two assessments (Table 4) indicate an average of 83.4% of the total nickel is in potentially recoverable mineral phases of Ni-sulfides and Ni-Fe alloys. The Company also analyzed copper deportment, with an average of 74% of the total copper in potentially recoverable mineral phases of Cu-sulfides and Cu-oxides. Additional deportment studies and bench scale metallurgical testing are on-going using core samples collected from the Company’s 2023 drill program. Results from these studies will be released when completed.
Table 4 – Summary of Ni-Cu Deportment work complete on the Nikolai Nickel Project
| PNI Composite (PNI-12-063) | Millrock Composite 1 (FL-003) | Millrock Composite 2 (FL-003) | |
| % Ni | 0.28 | 0.25 | 0.23 |
| % Ni in sulfides and alloys | 75.3 | 94.3 | 80.8 |
| % Ni in silicates | 20 | 5.1 | 18.9 |
| % Cu | 0.12 | 0.16 | 0.07 |
| % Cu in sulfides and oxides | NA | 72.4 | 75.5 |
| % Sulfur | 0.77 | 1.32 | 0.49 |
| Notes: Pure Nickel deportment study focused on Ni and Fe sulfides, with no results for Cu sulfides and oxides | |||
CHROME AND IRON
Chrome and iron have been identified as potentially significant co-products of mineralization at the Nikolai Nickel Project. Data the Company purchased in August 2023 had incomplete iron assay data and the analytical methods used to determine the concentration of chrome prevented the assessment of these elements in the 2024 MRE. The drilling completed by the Company in 2023 indicated an increase from 0.18% to 0.28% in the mean chrome assays and an increase from 8.2% to 8.8% in the mean iron assays relative to the historical purchased data. AEMC will continue to evaluate the chrome and iron data from the 2024 infill drill program, which is currently being planned. The Company has the objective of integrating these elements in future resource updates.
CAUTIONARY NOTE CONCERNING TECHNICAL DISCLOSURE AND U.S. SECURITIES LAWS
The MRE has been prepared in accordance with the requirements of the securities laws in effect in Canada, which differ in certain material respects from the disclosure requirements under United States securities laws. Unless otherwise indicated, all resource and reserve estimates included in this news release have been prepared in accordance with NI 43-101. The definitions used in NI 43-101 are incorporated by reference from the CIM Definition Standards.
The SEC Modernization Rules replaced the historical disclosure requirements for mining registrants that were included in SEC Industry Guide 7, which has been rescinded. As a result of the adoption of the SEC Modernization Rules, the SEC now recognizes estimates of “measured mineral resources”, “indicated mineral resources” and “inferred mineral resources”. Readers are cautioned that while the above terms are “substantially similar” to the corresponding CIM Definition Standards, there are differences in the definitions under the SEC Modernization Rules and the CIM Definition Standards. Accordingly, there is no assurance any mineral resources that the Company may report as “measured mineral resources”, “indicated mineral resources” and “inferred mineral resources” under NI 43-101 would be the same had the Company prepared mineral resource estimates under the standards adopted under the SEC Modernization Rules. Accordingly, information contained or incorporated by reference in this news release describing the Company’s mineral deposits may not be comparable to similar information made public by United States companies subject to the reporting and disclosure requirements under the United States federal securities laws and the rules and regulations thereunder.
QUALIFIED PERSON
Mr. Derek Loveday, P. Geo. of Stantec Consulting Services Inc. is the Qualified Person as defined by NI 43-101 who has prepared, or supervised the preparation of, or has reviewed and approved, the scientific and technical data pertaining to the MRE contained in this release, and will be preparing the NI-43-101 technical report for filing on SEDAR+ within 45 days.
Gabriel Graf, the Company’s Chief Geoscientist, is the qualified person, as defined under NI 43-101 having reviewed and approved all other scientific and technical information contained in this news release.
For additional information, visit: https://alaskaenergymetals.com/
ABOUT ALASKA ENERGY METALS
Alaska Energy Metals Corporation is focused on delineating and developing a large polymetallic exploration target containing nickel, copper, cobalt, chrome, iron, platinum, palladium, and gold. Located in central Alaska near existing transportation and power infrastructure, the Nikolai Nickel project is well-situated to become a significant, domestic source of critical and strategic energy-related metals for the American market.
ON BEHALF OF THE BOARD
“Gregory Beischer”
Gregory Beischer, President & CEO
FOR FURTHER INFORMATION, PLEASE CONTACT:
Gregory A. Beischer, President & CEO
Toll-Free: 877-217-8978 | Local: 604-638-3164
Sarah Mawji, Public Relations
Final Edit Media and Public Relations
Email: sarah@finaleditpr.com
Some statements in this news release may contain forward-looking information (within the meaning of Canadian securities legislation), including, without limitation, the estimation of mineral resources and that the Company (a) will file a NI43-101 technical report within 45 days, b) complete metallurgical and deportment studies, and c) plan and conduct further exploration drilling. These statements address future events and conditions and, as such, involve known and unknown risks, uncertainties, and other factors which may cause the actual results, performance, or achievements to be materially different from any future results, performance, or achievements expressed or implied by the statements. Forward-looking statements speak only as of the date those statements are made. Although the Company believes the expectations expressed in such forward-looking statements are based on reasonable assumptions, such statements are not guaranteeing of future performance and actual results may differ materially from those in the forward-looking statements. Factors that could cause the actual results to differ materially from those in forward-looking statements include but are not limited to uncertainty relating to the estimation of mineral resources, regulatory actions, market prices, and continued availability of capital and financing, and general economic, market or business conditions. Investors are cautioned that any such statements are not guarantees of future performance and actual results or developments may differ materially from those projected in the forward-looking statements. Forward-looking statements are based on the beliefs, estimates and opinions of the Company's management on the date the statements are made. Except as required by applicable law, the Company assumes no obligation to update or to publicly announce the results of any change to any forward-looking statement contained or incorporated by reference herein to reflect actual results, future events or developments, changes in assumptions, or changes in other factors affecting the forward-looking statements. If the Company updates any forward-looking statement(s), no inference should be drawn that it will make additional updates with respect to those or other forward-looking statements.
Neither the TSX Venture Exchange nor its Regulation Services Provider (as that term is defined in the policies of the TSX Venture Exchange) accepts responsibility for the adequacy or accuracy of this press release.
