VANCOUVER, British Columbia, Jan. 02, 2026 (GLOBE NEWSWIRE) -- The 2026 property assessments, which reflect market value as of July 1, 2025, have been announced for property owners of about 1,140,000 properties throughout the Lower Mainland. The updated property values are now available at bcassessment.ca in addition to 2026 Property Assessment Notices being mailed to each property owner.
"The softening housing market is being reflected in 2026 property assessments,” says BC Assessment Assessor Bryan Murao. "Many homeowners throughout the Lower Mainland can expect some decreases in assessed value with most changes ranging between -10% to 0%.”
“Vancouver Island and the Southern Interior are generally flatter in value with changes ranging between -5% to +5% while the North and the Kootenays are varying more broadly in the -5% to +15% range,” adds Murao.
As B.C.'s provider of property assessment information, BC Assessment collects, monitors and analyzes property data throughout the year. The newly released 2026 property assessment details can be searched and accessed any time at bcassessment.ca by using BC Assessment’s Assessment Search online service.
Overall, the Lower Mainland total assessments have decreased from about $2.01 trillion in 2025 to about $1.92 trillion this year. Almost $24 billion of the region’s updated assessments is from new construction, subdivisions and the rezoning of properties. The Lower Mainland region includes all of Greater Vancouver, the Fraser Valley as well as the Sea to Sky area and the Sunshine Coast.
The summaries below provide estimates of typical 2025 versus 2026 assessed value changes of residential properties for each community throughout the region.
These examples demonstrate market trends for single-family residential properties by geographic area:*
| Single Family Homes Changes by Community | 2025 Typical Assessed Value as of July 1, 2024 | 2026 Typical Assessed Value as of July 1, 2025 | % Change | ||
| City of Vancouver | $2,205,000 | $2,092,000 | -5% | ||
| University Endowment Lands | $5,535,000 | $5,090,000 | -8% | ||
| City of Burnaby | $2,044,000 | $1,959,000 | -4% | ||
| City of Coquitlam | $1,739,000 | $1,649,000 | -5% | ||
| City of Port Coquitlam | $1,416,000 | $1,358,000 | -4% | ||
| City of Port Moody | $1,852,000 | $1,778,000 | -4% | ||
| City of New Westminster | $1,590,000 | $1,560,000 | -2% | ||
| Village of Belcarra | $2,070,000 | $2,007,000 | -3% | ||
| Village of Anmore | $2,575,000 | $2,671,000 | +4% | ||
| District of North Vancouver | $2,124,000 | $2,056,000 | -3% | ||
| City of North Vancouver | $1,991,000 | $1,937,000 | -3% | ||
| District of West Vancouver | $3,054,000 | $2,910,000 | -5% | ||
| District of Squamish | $1,483,000 | $1,515,000 | +2% | ||
| Resort Municipality of Whistler | $2,821,000 | $2,834,000 | 0% | ||
| Village of Pemberton | $1,390,000 | $1,401,000 | +1% | ||
| Bowen Island Municipality | $1,372,000 | $1,367,000 | 0% | ||
| Village of Lions Bay | $2,023,000 | $1,995,000 | -1% | ||
| Town of Gibsons | $963,000 | $948,000 | -2% | ||
| District of Sechelt | $885,000 | $849,000 | -4% | ||
| City of Surrey | $1,563,000 | $1,464,000 | -6% | ||
| City of White Rock | $1,732,000 | $1,580,000 | -9% | ||
| City of Richmond | $1,890,000 | $1,745,000 | -8% | ||
| City of Delta | $1,410,000 | $1,353,000 | -4% | ||
| Township of Langley | $1,448,000 | $1,406,000 | -3% | ||
| City of Langley | $1,310,000 | $1,207,000 | -8% | ||
| City of Abbotsford | $1,144,000 | $1,082,000 | -5% | ||
| City of Chilliwack | $907,000 | $902,000 | -1% | ||
| City of Maple Ridge | $1,223,000 | $1,183,000 | -3% | ||
| City of Pitt Meadows | $1,285,000 | $1,239,000 | -4% | ||
| City of Mission | $1,037,000 | $993,000 | -4% | ||
| District of Kent | $778,000 | $778,000 | 0% | ||
| District of Hope | $628,000 | $628,000 | 0% | ||
| Harrison Hot Springs | $855,000 | $882,000 | +3% | ||
*All data calculated based on median values.
These examples demonstrate market trends for strata residential properties (e.g. condos/townhouses) by geographic area for select urban areas:*
| Strata Homes (Condos/Townhouses) Changes by Community | 2025 Typical Assessed Value as of July 1, 2024 | 2026 Typical Assessed Value as of July 1, 2025 | % Change | ||
| City of Vancouver | $798,000 | $772,000 | -3% | ||
| City of Burnaby | $732,000 | $706,000 | -4% | ||
| City of Coquitlam | $727,000 | $699,000 | -4% | ||
| City of Port Coquitlam | $680,000 | $648,000 | -5% | ||
| City of Port Moody | $841,000 | $797,000 | -5% | ||
| City of New Westminster | $644,000 | $617,000 | -4% | ||
| City of North Vancouver | $839,000 | $820,000 | -2% | ||
| District of North Vancouver | $945,000 | $928,000 | -2% | ||
| District of West Vancouver | $1,388,000 | $1,354,000 | -2% | ||
| District of Squamish | $832,000 | $848,000 | +2% | ||
| Resort Municipality of Whistler | $1,341,000 | $1,328,000 | -1% | ||
| City of Surrey | $695,000 | $649,000 | -7% | ||
| City of White Rock | $645,000 | $609,000 | -6% | ||
| City of Richmond | $784,000 | $735,000 | -6% | ||
| City of Delta | $759,000 | $722,000 | -5% | ||
| Township of Langley | $761,000 | $737,000 | -3% | ||
| City of Langley | $547,000 | $521,000 | -5% | ||
| City of Abbotsford | $487,000 | $470,000 | -3% | ||
| City of Maple Ridge | $650,000 | $635,000 | -2% | ||
*All data calculated based on median values.
BC Assessment’s website at bcassessment.ca includes more details about 2026 assessments, property information and trends such as lists of 2026’s top valued residential properties across the province and an interactive map.
The website also provides self-service access to a free, online property assessment search service that allows anyone to search, check and compare 2026 property assessments for anywhere in the province. Property owners can also download a digital copy of their 2026 property assessment.
“Property owners can find valuable information on our website including answers to many assessment-related questions, but those who feel that their property assessment does not reflect market value as of July 1, 2025 or see incorrect information on their notice, should contact BC Assessment as indicated on their notice as soon as possible in January,” says Murao.
“If a property owner is still concerned about their assessment after speaking to one of our appraisers, they may submit a Notice of Complaint (Appeal) by February 2, for an independent review by a Property Assessment Review Panel,” adds Murao.
The Property Assessment Review Panels, independent of BC Assessment, are appointed annually by the provincial government, and typically meet from early February to mid-March to hear formal complaints.
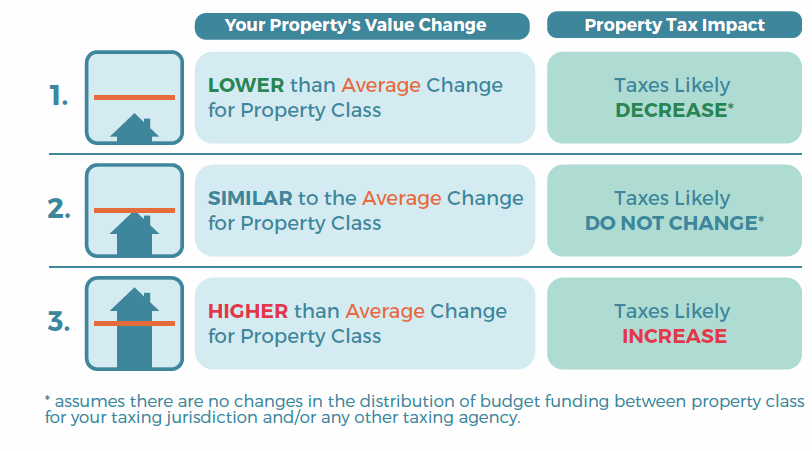
"It is important to understand that changes in property assessments do not automatically translate into a corresponding change in property taxes," explains Murao. "As noted on your assessment notice, how your assessment changes relative to the average change in your community is what may affect your property taxes."
Have questions?
Property owners can contact BC Assessment toll-free at 1-866-valueBC (1-866-825-8322) or online at bcassessment.ca. During the month of January, hours of operation are 8:30 a.m. to 5:00 p.m., Monday to Friday.
Media contact:
Tim Morrison, BC Assessment Senior Communications Advisor
Email: tim.morrison@bcassessment.ca
Please see attached British Columbia's 2026 Top 500 Valued Homes list and the Lower Mainland's Top 100 Valued Homes list at:
http://ml.globenewswire.com/Resource/Download/f6a8d79a-10dd-406b-98c9-25f5db367bb3
http://ml.globenewswire.com/Resource/Download/67547be7-aa0a-4b73-b8e6-f4d101ccbb9b
An infographic accompanying this announcement is available at https://www.globenewswire.com/NewsRoom/AttachmentNg/276837e6-7e5f-43e1-b844-53dbd9de7f4f
